In my previous blog “How DevOps Drives Analytics Operationalization and Monetization”, I discussed the critical and complementary role of DevOps to operationalize and monetize the analytics that came out of the Data Science development process. While the combination of Design Thinking and Data Science accelerate the creation of more effective, more predictive analytic modules (where analytic modules are packaged, reusable and extensible analytic modules), it’s the combination of Data Science and DevOps that drives analytic model operationalization and monetization (see Figure 1).
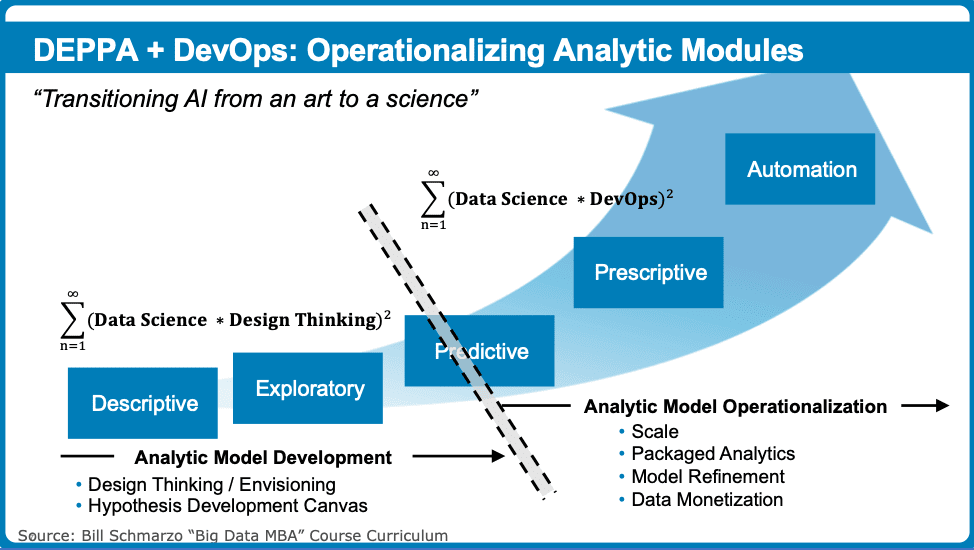
Figure 1: Developing and Operationalizing Data Science
Figure 1 highlights two key stages of the analytic model development and operationalization:
- Analytic Model Developmentexploits the harmonizing nature of design thinking to help identify (brainstorm) and ultimately codify the patterns, trends, associations and relationships buried in the data that yield better predictors of performance.
- Analytic Model Operationalizationrequires close collaboration between Data Science and DevOps to integrate or embed the analytic models into the operational and management systems, and to establish a regular measurement and feedback process in order to continuously tweak and improve analytic model performance.
Data Science, Design Thinking and DevOps are critical components in the analytic model development and operationalization, but we are still missing a critical piece of the “Data Monetization Value Chain” – DataOps.
But as always with my blogs, we need to first start with an analogy to help us understand this “Data Monetization Value Chain.” And let’s go back to our friendly neighborhood economic metaphor…oil.
Economics of Oil ≈ Economics of Data
My blog “Data Curation: Weaving Raw Data into Business Gold” discussed the similarities between the economics of oil and the economics of data; that data will fuel economic growth in the 21st century in much the same way that oil fueled economic growth of the 20th century. The blog touched on the fact that the real economic value isn’t in the raw oil, but actually rests in the “curated” fuel.Raw oil goes through a refinement, blending and engineering process where the crude oil is transformed into more valuable products such as petroleum naphtha, gasoline, diesel fuel, asphalt base, heating oil, kerosene, liquefied petroleum gas, jet fuel and fuel oils. This is a critical process that needs to be performed before the end users (like you and me and industrial concerns) can actually get value out of the oil (see Figure 2).
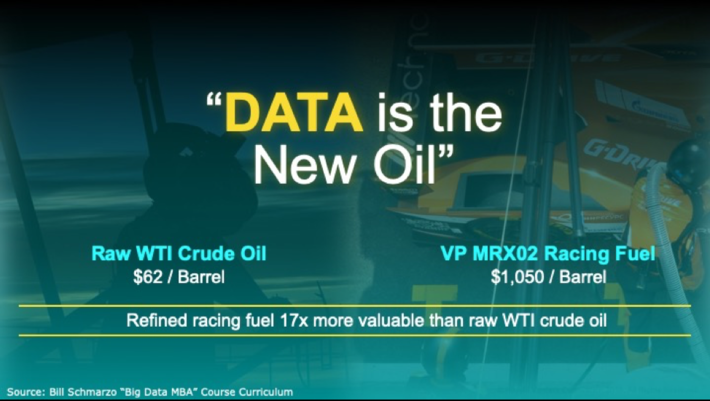
Figure 2: Data is the New Oil
There is a complete “Oil Monetization Value Chain” (see Figure 3) that includes the following sectors[1]:
- The upstream sector involves the exploration for and extraction of petroleum crude oil and natural gas. The upstream oil sector is also known as the exploration and production (E&P) sector. The upstream sector includes the searching for potential underground or underwater oil and gas fields, drilling of exploratory wells, and subsequently operating the wells that recover and bring the petroleum crude oil and/or raw natural gas to the surface.
- The midstream sector involves storing, marketing and transporting petroleum crude oil, natural gas, natural gas liquids (mainly ethane, propane and butane) and byproduct sulfur. Midstream operations are sometimes included in the downstream category.
- The downstream sector involves the refining of petroleum crude oil and the processing of raw natural gas. It includes the selling and distribution of processed natural gas and the products derived from petroleum crude oil such as liquified petroleum gas (LPG), gasoline (or petrol), jet fuel, diesel oil, other fuel oils, petroleum asphalt and petroleum coke.
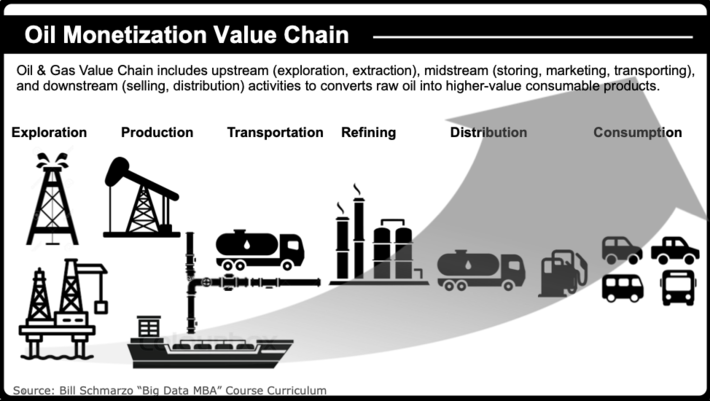
Figure 3: Oil Monetization Value Chain
Well, the story of converting raw data into customer, product and operational insights that helps organizations power their business and operational models is quite similar. It’s just that we are missing a key component of the “Data Monetization Value Chain” – DataOps.
The Role of DataOps
So, what is DataOps?
DataOps is the formal discipline of data gathering, assembly, management, curation and publication that includes:
- Data Validationincluding cleanliness, completeness, alignment, accuracy, granularity, timeliness and latency.
- Metadata Enrichmentincluding descriptive metadata, structural metadata, administrative metadata, reference metadata and statistical metadata.
- Governanceto ensure availability, usability, integrity, security and usage compliance across use cases.
- Data Cataloging and Indexingso the data can be easily searched, found, accessed, understood and re-used.
DataOps is the key to driving the productivity and effectiveness of your data science team. Itenables your data science team to explore variables and metrics that might be better predictors of performance, and not be burdened on the data aggregation, cleansing, integration, alignment, preparation, curation and publication processes (see Figure 4).
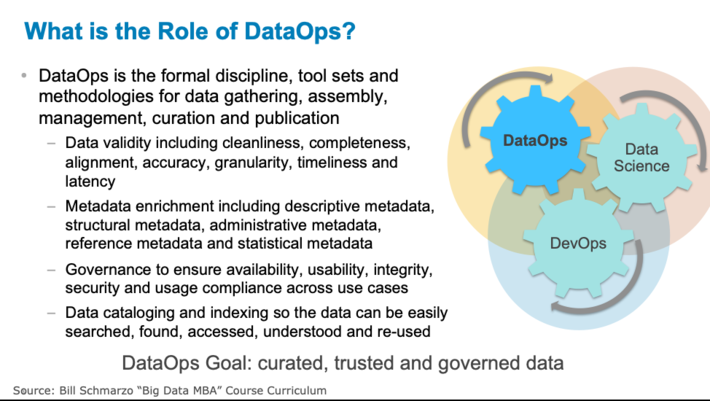
Figure 4: What is DataOps?
DataOps is the missing piece of an organization’s Data Monetization Value Chain. DataOps forms the foundation in helping organizations become more effective at leveraging data and analytics to power their business and operational models (see Figure 5).
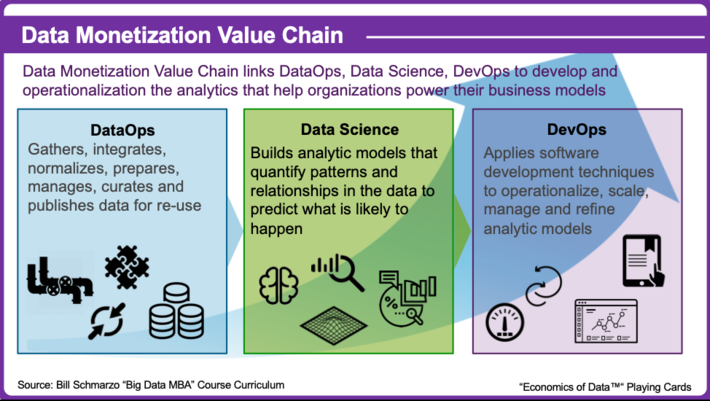
Figure 5: Data Monetization Value Chain
2019 will be the year of the Data Engineer, and consequently 2019 will also be the year of DataOps. In much the same way that oil is converted into an asset that is 15x to 25x more valuable than the raw asset, the Data Engineer will embrace DataOps to drive the increase in the value of an organization’s data.But with one small exception:
How much more valuable is data than oil when data never depletes, never wears out and the same curated data set can be used across a limitless number of use cases at a marginal cost near zero?
Well, that’ll be the key equation that separates the winners from the wannabe’s in the 21st century economic battles.
In the end, the organizations that win will be those organizations who become more effective at exploiting the unique economic characteristics of data and analytics to power their business and operational models (see Figure 6).
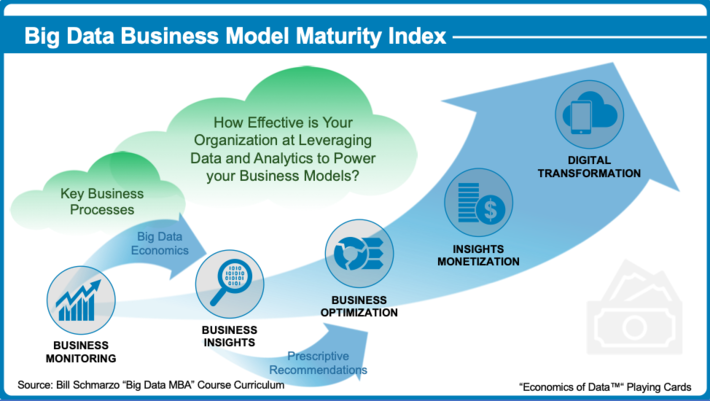
Figure 6: Big Data Business Model Maturity Index
How effective is your organization at leveraging data and analytics to power your business models?
Simple as hell question to ask. Hard as hell question to answer. But if you can’t answer that question, you’ve got no chance of success in the data and analytics-infused 21st century economic battles!
[1]Marine, Oil and Gas Academy (MOGA), Oil & Gas Value Chains
