The Problem
Millions of people are forced to leave their current area of residence or community due to resource shortage and natural disasters such as droughts, floods. Our project partner, UNHCR, provides assistance and protection for those who are forcibly displaced inside Somalia.
The goal of this project was to create a solution that quantifies the influence of climate change anomalies on forced displacement and/or violent conflict through satellite imaging analysis and neural networks for Somalia.
The Data
The UNHCR Innovation team provided the displacement dataset, which contains:
Month End, Year Week, Current (Arrival) Region, Current (Arrival) District, Previous (Departure) Region, Previous (Departure) District, Reason, Current (Arrival) Priority Need, Number of Individuals. These internal displacements are weekly recorded since 2016.
While searching for how to extract the data we learned about NDVI (Normalized difference vegetation index), and NDWI (Normalized Difference Water Index).
Our focus was on finding a way to apply NDVI and NDWI on Satellite Imaging and Neural Networks to prevent Climate Change disasters.
Landsat (EarthExplorer) and MODIS, Hydrology (e.g. river levels, river discharge, an indication of floods/drought), Settlement/shelters GEO (GEO portal). These images have 13 bands and take up around 1GB of storage space per image.
Also, the National Environmental Satellite, Data, and Information Service (NESDIS) and National Oceanic and Atmospheric Administration (NOAA) offer very interesting data like Somalia Vegetation Health print screens taken from STAR – Global Vegetation Health Products.
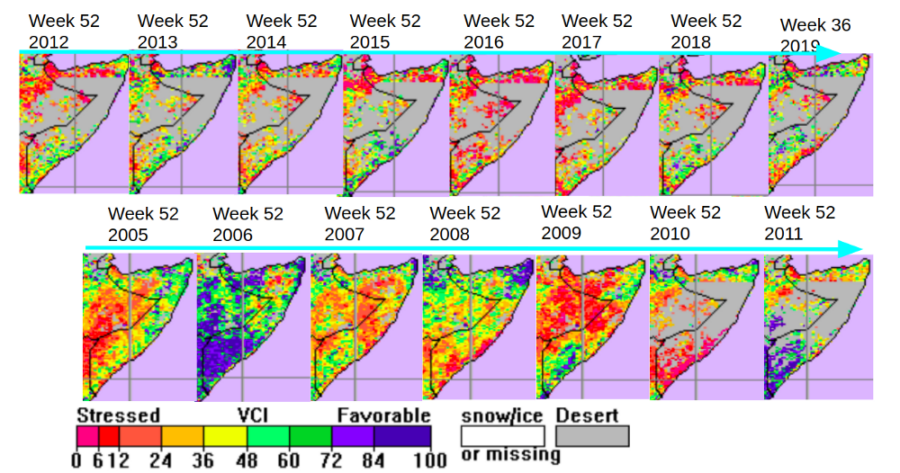
By looking at the above picture points I figured that the Vegetation Health Index (VHI) could be having a correlation with people displacement.
We found an interesting chart, which captured my attention,
- Go to STAR’s web page.
- Click on Data type and select which kind of data you want
- Check the following image
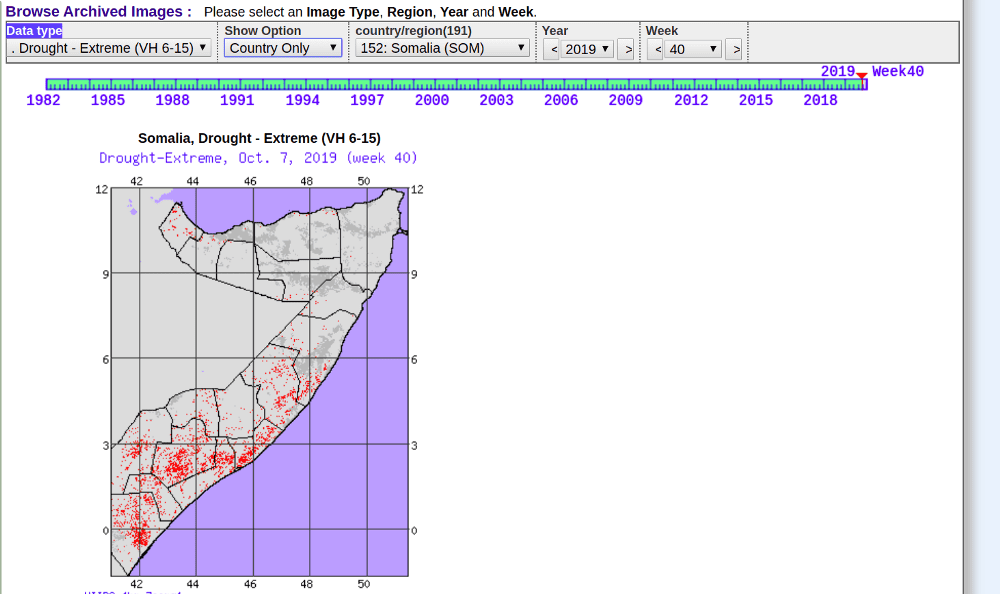
- Click on the region of interest and follow the steps below
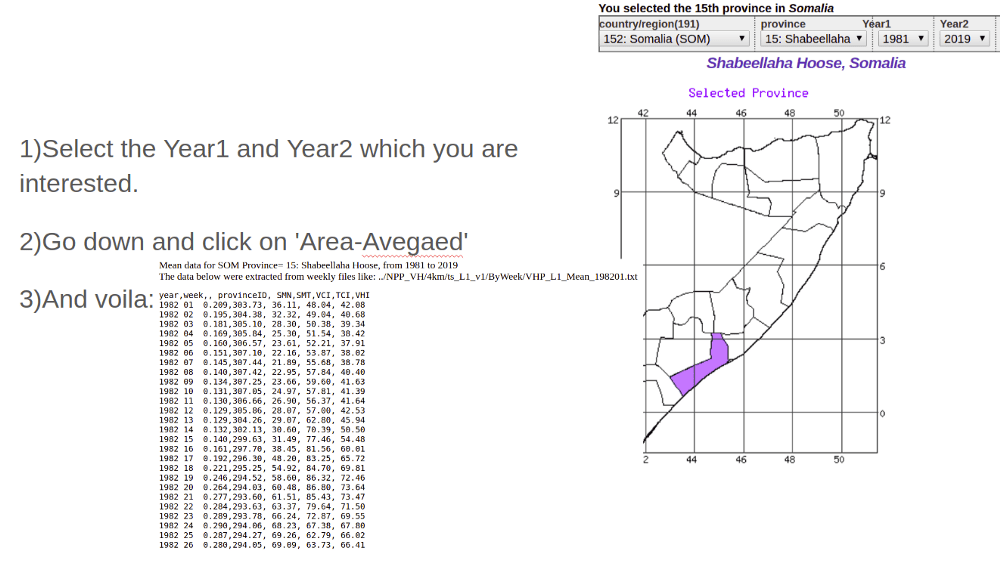
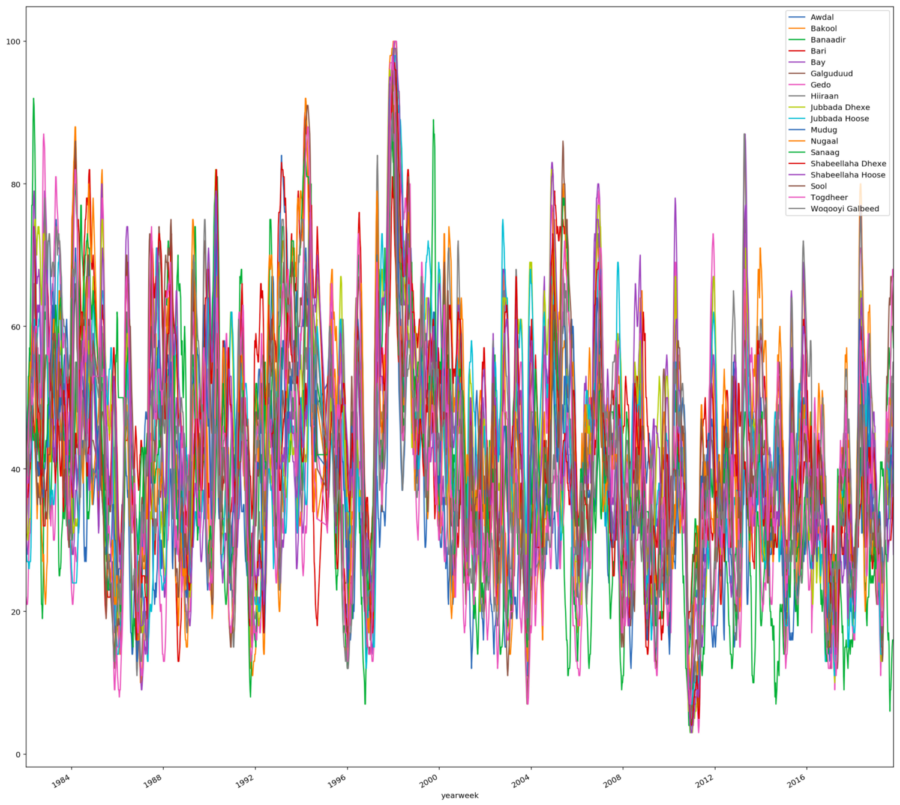
VHI index’s weekly since 1984
STAR’s web page provides SMN, SMT, VCI, TCI, VHI index’s weekly since 1984 split in provinces.
SMN= Provincial mean NDVI with noise reduced
SMT=Provincial mean brightness Temperature with noice reduced
VCI = Vegetation cond index ( VCI <40 indicates moisture stress; VCI >60: favorable condition)
TCI= thermal condition Index (TCI <40 indicates thermal stress; TCI >60: favorable condition)
VHI =vegetation Health Index (VHI <40 indicates vegetation stress; VHI >60: favorable condition))
Drought vegetation
VHI<15 indicates drought from severe-to-exceptional intensity
VHI<35 indicates drought from moderate-to-exceptional intensity
VHI>65 indicates good vegetation condition
VHI>85 indicates very good vegetation condition
In order to derive insights from the findings, the following questions needed to be answered.
Does vegetation health correlate to displacements? And is there a lag between vegetation health and observed displacement? Below visualizations provide answers.
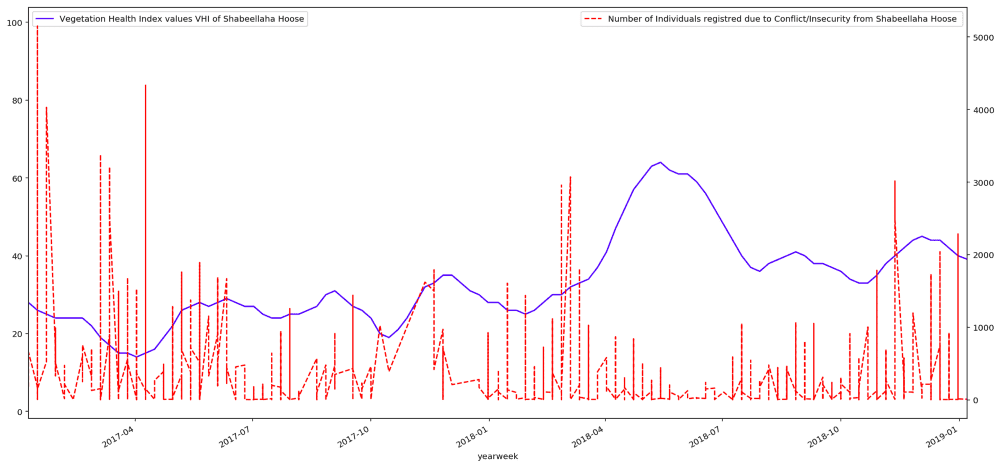
Correlation between Vegetation Health Index values of Shabeellaha Hoose and the number of individuals registered due to Conflict/Insecurity.
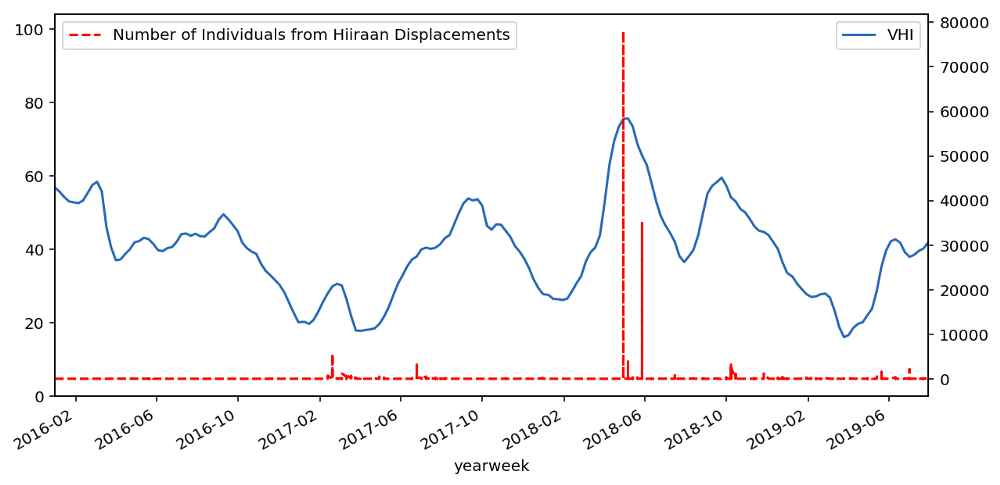
Correlation between the Number of Individuals from Hiiraan Displacements caused by flood and VHI data. Source: Omdena.com
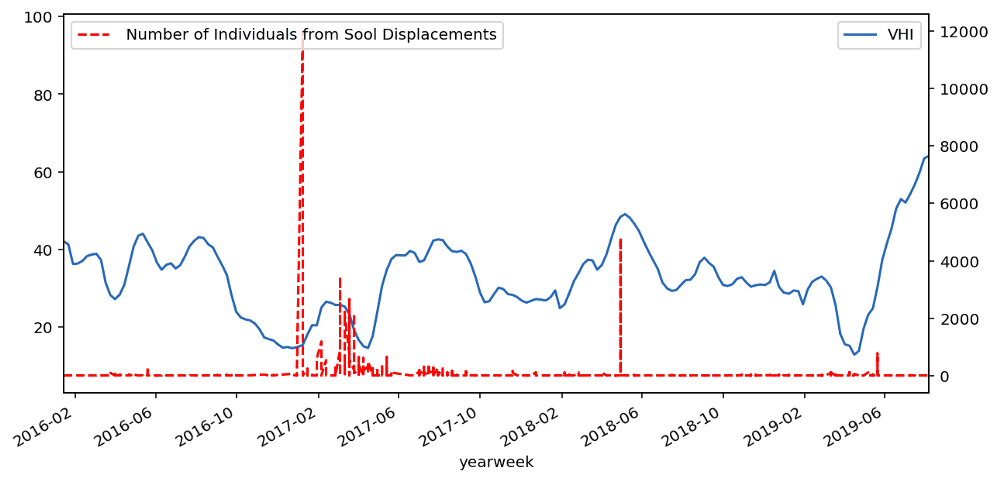
Correlation between the Number of Individuals from Sool Displacements caused by drought. Source: Omdena
The Solution: Building the Neural Network
We developed a neural network that predicts the weekly VHI of Somalia using historical data as described above.
You can find the model here.
The model produces a validation loss of 0.030 and training loss of 0.005, Below is the prediction of the neural network using test data.
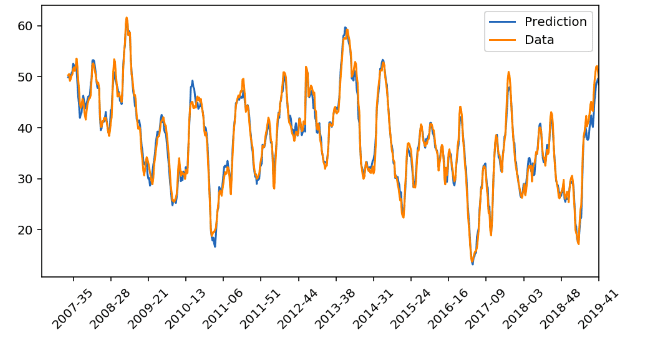
Prediction versus the original value
