I’m reposting this blog (with updated graphics) because I still get many questions about the difference between Business Intelligence and Data Science. Hope this blog helps.
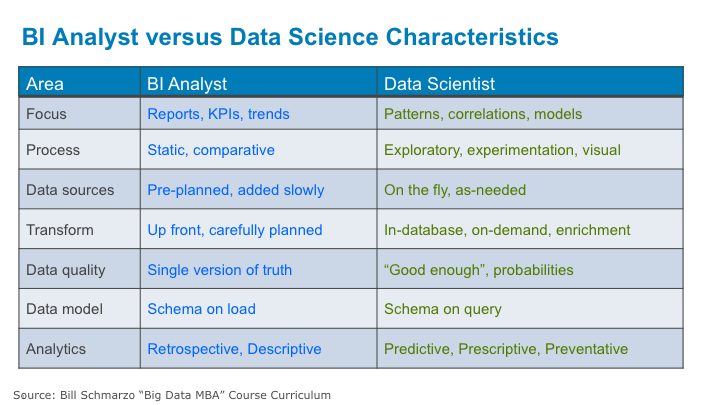
I recently had a client ask me to explain to his management team the difference between a Business Intelligence (BI) Analyst and a Data Scientist. I frequently hear this question, and typically resort to showing Figure 1 (BI Analyst vs. Data Scientist Characteristics chart, which shows the different attitudinal approaches for each)…
Figure 1: BI Analyst vs. Data Scientist Characteristics
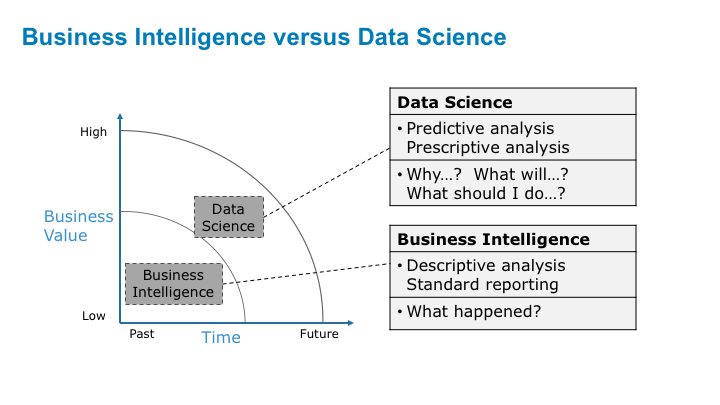
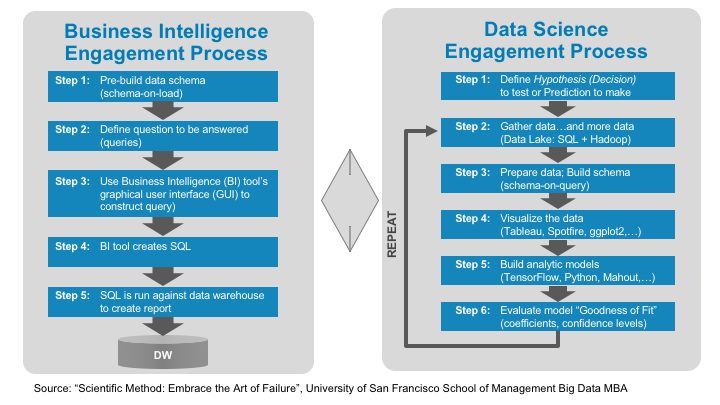
…and Figure 2 (Business Intelligence vs. Data Science, which shows the different types of questions that each tries to address) in response to this question.
Figure 2: Business Intelligence vs. Data Science
But these slides lack the context required to satisfactorily answer the question – I’m never sure the audience really understands the inherent differences between what a BI analyst does and what a data scientist does. The key is to understand the differences between the BI analyst’s and data scientist’s goals, tools, techniques and approaches. Here’s the explanation.The Business Intelligence (BI) Analyst Engagement Process
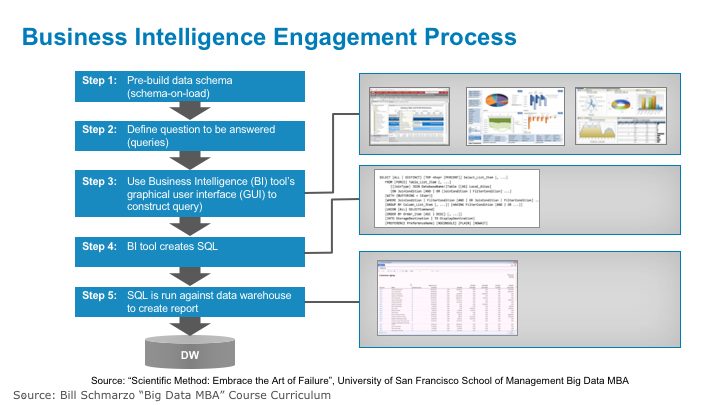
Figure 3 outlines the high-level analytic process that a typical BI Analyst uses when engaging with the business users.
Figure 3: Business Intelligence Engagement Process
Step 1: Build the Data Model. The process starts by building the underlying data model. Whether you use a data warehouse or data mart or hub-and-spoke approach, or whether you use a star schema, snowflake schema, or third normal form schema, the BI Analyst must go through a formal requirements gathering process with the business users to identify all (or at least the vast majority of) the questions that the business users want to answer. In this requirements gathering process, the BI analyst must identify the first and second level questions the business users want to address in order to build a robust and scalable data warehouse. For example:
• 1st level question: How many patients did we treat last month?
- 2nd level question: How did that compare to the previous month?
- 2nd level question: What were the major DRG types treated?
• 1st level question: How many patients came through ER last night?
- 2nd level question: How did that compare to the previous night?
- 2nd level question: What were the top admission reasons?
• 1st level question: What percentage of beds was used at Hospital X last week?
- 2nd level question: What is the trend of bed utilization over the past year?
- 2nd level question: What departments had the largest increase in bed utilization?
The BI Analyst then works closely with the data warehouse team to define and build the underlying data models that supports the questions being asked.
Note: the data warehouse is a “schema-on-load” approach because the data schema must be defined and built prior to loading data into the data warehouse. Without an underlying data model, the BI tools will not work.
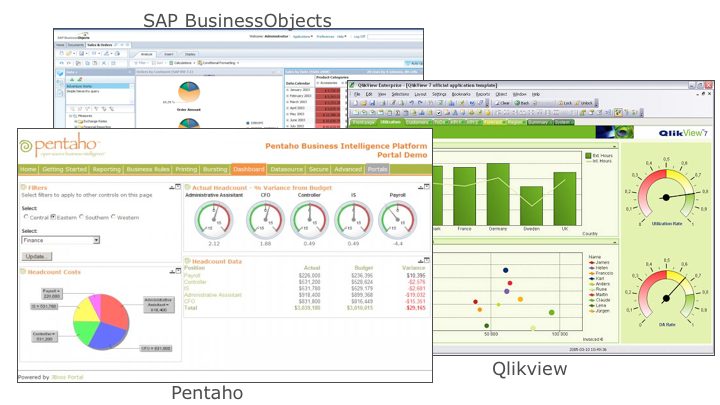
Step 2: Define The Report. Once the analytic requirements have been transcribed into a data model, then step 2 of the process is where the BI Analyst uses a Business Intelligence (BI) product – SAP Business Objects, MicroStrategy, Cognos, Qlikview, Pentaho, etc. – to create the SQL-based query for the desired questions (see Figure 4).
Figure 4: Business Intelligence (BI) Tools
The BI Analyst will use the BI tool’s graphical user interface (GUI) to create the SQL query by selecting the measures and dimensions; selecting page, column and page descriptors; specifying constraints, subtotals and totals, creating special calculations (mean, moving average, rank, share of) and selecting sort criteria. The BI GUI hides much of the complexity of creating the SQL
Step 3: Generate SQL commands. Once the BI Analyst or the business user has defined the desired report or query request, the BI tool then creates the SQL commands. In some cases, the BI Analyst will modify the SQL commands generated by the BI tool to include unique SQL commands that may not be supported by the BI tool.
Step 4: Create Report. In step 4, the BI tool issues the SQL commands against the data warehouse and creates the corresponding report or dashboard widget. This is a highly iterative process, where the Business Analyst will tweak the SQL (either using the GUI or hand-coding the SQL statement) to fine-tune the SQL request. The BI Analyst can also specify graphical rendering options (bar charts, line charts, pie charts) until they get the exact report and/or graphic that they want (see Figure 5).
Figure 5: Typical BI Tool Graphic Options
By the way, this is a good example of the power of schema-on-load. This traditional schema-on-load approach removes much of the underlying data complexity from the business users who can then use the GUI BI tools to more easily interact and explore the data (think self-service BI).
In summary, the BI approach leans heavily on the pre-built data warehouse (schema-on-load), which enables users to quickly, and easily ask further questions – as long as the data that they need is already in the data warehouse. If the data is not in the data warehouse, then adding data to an existing warehouse (and creating all the supporting ETL processes) can take months to make happen.
The Data Scientist Engagement Process
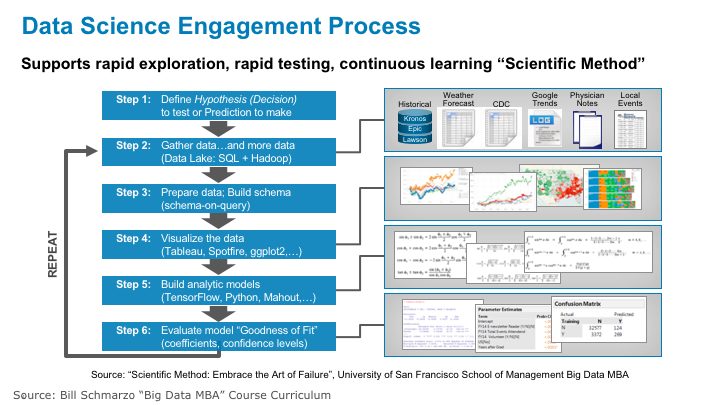
Figure 6 lays out the Data Scientist engagement process.
Figure 6: Data Scientist Engagement Process
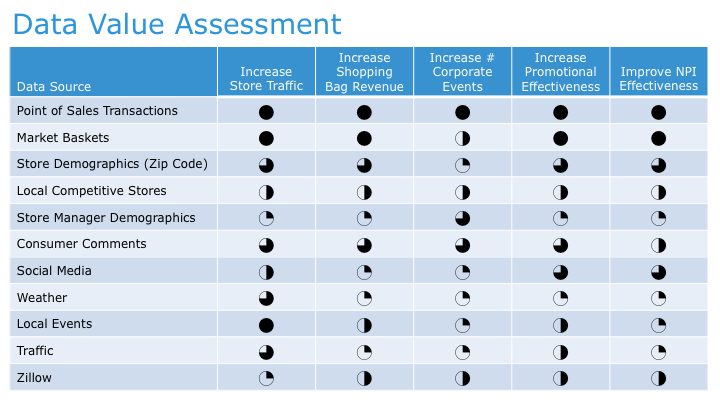
Step 1: Define Hypothesis To Test. Step 1 of the Data Scientist process starts with the Data Scientist identifying the prediction or hypothesis that they want to test. Again, this is a result of collaborating with the business users to understand the key sources of business differentiation (e.g., how the organization delivers value) and then brainstorming data and variables that might yield better predictorsof performance. This is where a Vision Workshopprocess can add considerable value in driving the collaboration between the business users and the data scientists to identify data sources that mayhelp improve predictive value (see Figure 7).
Figure 7: Vision Workshop Data Assessment Matrix
Step 2: Gather Data. Step 2 of the Data Science process is where the data scientist gathers relevant and/or interesting data from a multitude of sources – ideally both internal and external to the organization. The data lakeis a great approach for this process, as the data scientist can grab any data they want, test it, ascertain its value given the hypothesis or prediction, and then decide whether to include that data in the predictive model or throw it away. #FailFast #FailQuietly
Step 3: Build Data Model. Step 3 is where the data scientist defines and builds the schema necessary to address the hypothesis being tested. The data scientist can’t define the schema until they know the hypothesis that they are testing AND know what data sources they are going to be using to build their analytic models.
Note: this “schema on query” process is notably different than the traditional data warehouse “schema on load” process. The data scientist doesn’t spend months integrating all the different data sources together into a formal data model first. Instead, the data scientist will define the schema as needed based upon the data that is being used in the analysis. The data scientist will likely iterate through several different versions of the schema until finding a schema (and analytic model) that sufficiently answers the hypothesis being tested.
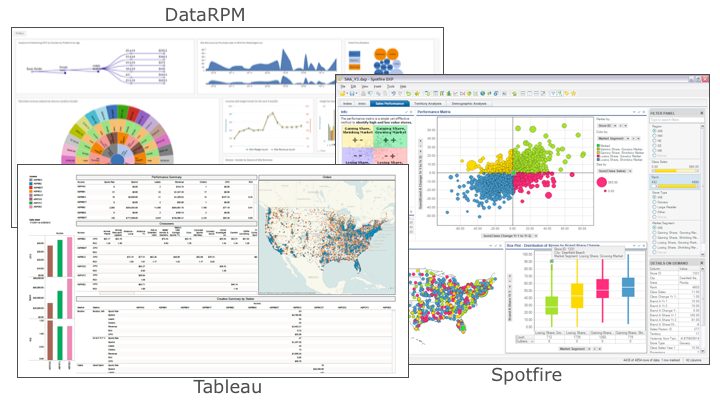
Step 4: Explore The Data. Step 4 of the Data Science process leverages the outstanding data visualization tools to uncover correlations and outliers of interest in the data. Data visualization tools like Tableau, Spotfire, Domo and DataRPM[1]are great data scientist tools for exploring the data and identifying variables that they might want to test (see Figure 8).
Figure 8: Sample Data Visualization Tools
Step 4: Build and Refine Analytic Models. Step 4 is where the real data science work begins – where the data scientist starts using tools like SAS, SAS Miner, R, Mahout, MADlib, and Alpine Miner to build analytic models. This is true science, baby!! At this point, the data scientist will explore different analytic techniques and algorithms to try to create the most predictive models. As my data scientist friend Wei Lin shared with me, this includes some of the following algorithmic techniques:
Markov chain, genetic algorithm, geo fencing, individualized modeling, propensity analysis, neural network, Bayesian reasoning, principal component analysis, singular value decomposition, optimization, linear programming, non-linear programming and more.
All in the name of trying to quantify cause-and-effect! I don’t suggest trying to win a game of chess against one these guys.
Step 5: Ascertain Goodness of Fit. Step 5 in the data science process is where the data scientist will try to ascertain the model’s goodness of fit. The goodness of fit of a statistical model describes how well the model fits a set of observations. A number of different analytic techniques will be used to determine the goodness of fit including Kolmogorov–Smirnov test, Pearson’s chi-squared test, analysis of variance (ANOVA) and confusion (or error) matrix..
Summary
My point isn’t that Business Intelligence and schema-on-load is bad, and data science and schema-on-query is good. It’s that they address different types of questions. They are different approaches, intended for different environments, and used at different stages in the analysis process. In the BI process, the schema must be built first and must be built to support a wide variety of questions across a wide range of business functions. So the data model must be extensible and scalable which means that it is heavily engineered. Think production quality. In the data science process, the schema is built to only support the hypothesis being tested so the data model can be done more quickly and with less overhead. Think ad hoc quality.
The data science process is highly collaborative; the more subject matter experts involved in the process, the better the resulting model. And maybe even more importantly, involvement of the business users throughout the process ensures that the data scientists focuses on uncovering analytic insights that pass the S.A.M. test – Strategic (to the business), Actionable (insights that the organization can actually act on), and Material (where the value of acting on the insights is greater than the cost of acting on the insights).
[1]Disclaimer: I serve on DataRPM’s Advisory Board

