
How can we quantify GenAI’s performance impact on employees with below-average to average performance compared to high-performance employees?
I have had the privilege of working with Mark Stouse to address this question. While there are numerous anecdotal examples, we aimed to answer this question quantitatively. Our process is outlined in this blog, and here is what we found:
- Focusing on GenAI’s innovative use rather than productivity use resulted in a 3x improvement in outcomes.
- GenAI can bring below-average performers closer to average and marginally improve average performers, but the real advantage lies in its innovative focus on empowering the top 30% of employees.
The methodology is not flawless, but a starting point for others to challenge and expand upon. This enables us to harness these GenAI tools better to foster human curiosity, exploration, and imagination, which can lead to innovative solutions for some of society’s toughest challenges. Let’s dive into the methodology, its assumptions, and its results.
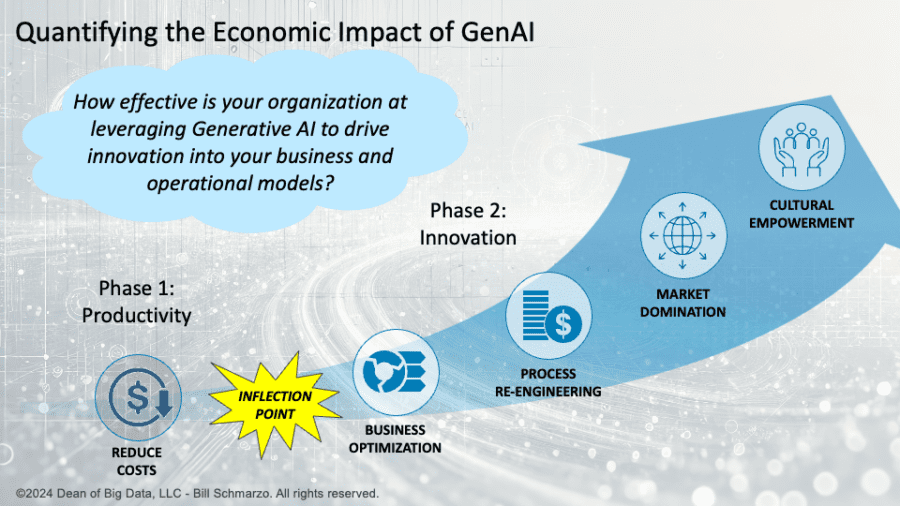
The GenAI Challenge: Efficiency (Productivity) versus Effectiveness (Innovation)
We have been vocal about my belief that organizations focusing on GenAI-driven productivity improvements rather than GenAI-driven innovation improvements are missing the bigger prize. GenAI tools can create value for an organization, but that increase in value is inconsistent. On one hand, GenAI tools can improve the productivity (efficiency) of below-average workers. On the other hand, they can significantly boost the innovation (effectiveness) of top-performing workers who better understand critical value-creation concepts such as data science, design thinking, and economics.
- Efficiency measures productivity and the ability to produce a result with minimal waste of time, effort, and resources.
- Effectiveness is a measure of innovation and the ability to produce a better result that delivers more value or achieves a better outcome.
This dilemma begs the following question:
Should we focus our GenAI investments on raising the performance of below-average performers or expanding and accelerating the creativity of our high-performance employees?
We wanted to consider this question objectively and quantitatively. So, here’s my attempt to do that. While the approach has flaws and this blog reads like one of those boring research reports, what we learned from the process surprised us.
Worker Performance Bell Curve (Normal) Distribution
To start this analysis, we first constructed a normal distribution of workers’ performance, with most workers falling within the “average” performance range and a tail distribution representing “below-average” and “high-performance” workers. For simplicity reasons, we decided to create two worker segments.
- Productivity segment – focused on raising the efficiency of below-average performers to the level of average performers.
- Innovation segment – focused on empowering above-average performers with the skills and creative capabilities (data science, design thinking, economics) to dramatically improve operational effectiveness.
We assumed that workers who were average or below would focus on productivity (efficiency) improvements, and those above average would leverage GenAI tools to drive innovation (effectiveness) improvements (Figure 1).
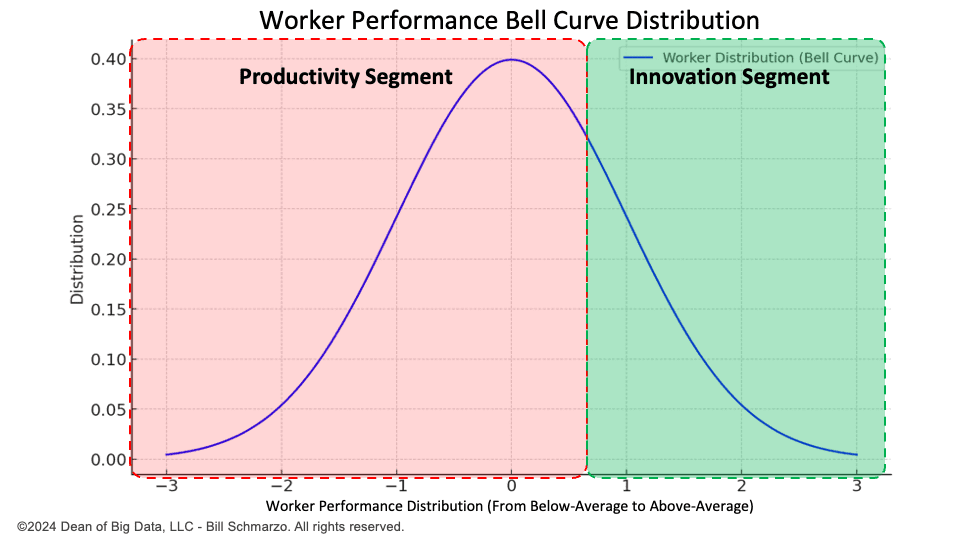
Figure 1: Worker Performance Normal Distribution
This yielded the following distribution of workers and their performance segments (see Table 1).
| Standard Deviations from Mean | Distribution of workers | Performance Category |
| -2.55 to -2.05 | 2% | Productivity |
| -2.05 to -1.55 | 2% | Productivity |
| -1.55 to -1.05 | 7% | Productivity |
| -1.05 to -0.56 | 19% | Productivity |
| -0.56 to -0.06 | 16% | Productivity |
| -0.06 to 0.44 | 20% | Productivity |
| 0.44 to 0.94 | 15% | Innovation |
| 0.94 to 1.44 | 10% | Innovation |
| 1.44 to 1.94 | 5% | Innovation |
| 1.94 to 2.44 | 4% | Innovation |
Next, for the Productivity segment, we used Google Gemini[1] to calculate the productivity improvement of raising below-average performers’ productivity to that of the average worker (the green box in Figure 1). Here is the prompt that we used:
==========
Gemini Prompt: What productivity improvement is required to move someone -2.05 and 2.55 deviations from the mean to the average?
Gemini Response: Based on the normal distribution, we can estimate that an improvement of approximately 48.78% is needed to get the person’s productivity to the average level (50th percentile).
Here’s a breakdown of the logic behind the estimation:
- We know the person’s productivity is between 2.05 and 2.55 standard deviations below the mean (represented by a z-score of -2.25).
- We can estimate the percentile corresponding to this z-score using the normal distribution’s cumulative distribution function (CDF). In this case, it’s approximately 1.22%.
- The average percentile (50th percentile) represents the median productivity level.
- The difference between these percentiles (48.78%) indicates the improvement needed to reach the average level.
==========
Next, for the Innovation segment, we assumed that the top 4% of workers could improve their effectiveness 8x or 800%. We used the 800% number based upon a McKinsey report titled “Attracting and retaining the right talent” that had the following observation:
“It’s remarkable how much of a productivity kicker an organization gets from top talent. A recent study of more than 600,000 researchers, entertainers, politicians, and athletes found that high performers are 400 percent more productive than average ones.2 Studies of businesses not only show similar results but also reveal that the gap rises with a job’s complexity. In highly complex occupations—the information- and interaction-intensive work of managers, software developers, and the like—high performers are an astounding 800 percent more productive (Exhibit 1).”
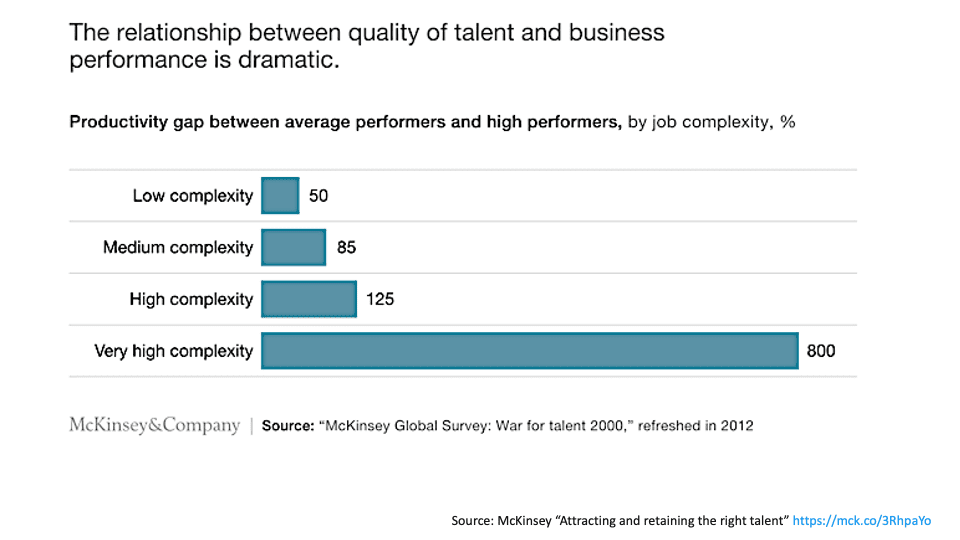
Exhibit 1: McKinsey “Attracting and retaining the right talent”
We then made the gross assumption of the performance improvements for our top-performing workers who have a deeper understanding of the business (customer needs, market demands, competitive situation, operational execution challenges, etc.), plus training in data science, design thinking, and data (digital) economics (Table 2).
| Standard Deviations | Percentage of Workers | Efficiency Category | Performance Improvements |
| 0.44 to 0.94 | 15% | Innovation | 50% |
| 0.94 to 1.44 | 10% | Innovation | 100% |
| 1.44 to 1.94 | 5% | Innovation | 400% |
| 1.94 to 2.44 | 4% | Innovation | 800% |
See Appendix A for examples of where workers can use GenAI for more innovative purposes.
The Final Result
Table 3 lists the final results of our analysis.
| Range (Standard Deviations) | Dell Curve Distribution | Efficiency Category | Efficiency Gains | Output Increase |
| -2.55 to -2.05 | 2% | Productivity | 48.78% | 2.98 |
| -2.05 to -1.55 | 2% | Productivity | 18.41% | 2.37 |
| -1.55 to -1.05 | 7% | Productivity | 12.92% | 7.90 |
| -1.05 to -0.56 | 19% | Productivity | 7.35% | 20.40 |
| -0.56 to -0.06 | 16% | Productivity | 4.49% | 16.72 |
| -0.06 to 0.44 | 20% | Productivity | 1.96% | 20.39 |
| 0.44 to 0.94 | 15% | Innovation | 50.00% | 22.50 |
| 0.94 to 1.44 | 10% | Innovation | 100.00% | 20.00 |
| 1.44 to 1.94 | 5% | Innovation | 400.00% | 25.00 |
| 1.94 to 2.44 | 4% | Innovation | 800.00% | 36.00 |
In summary of Table 3:
- Productivity Segment: Representing 66% of the workers, this segment yields an incremental increase of 70.75 outcomes, resulting in a Performance Improvement Index of 107.20 (where the “Performance Improvement Index” equals the “Total Increase in” divided by “Percentage of workers”).
- Innovation Segment: Representing 34% of the workers, this segment yields an incremental increase of 103.50 outcomes, resulting in a Performance Improvement Index of 304.41.
See Figure 2 for the analysis in chart format.
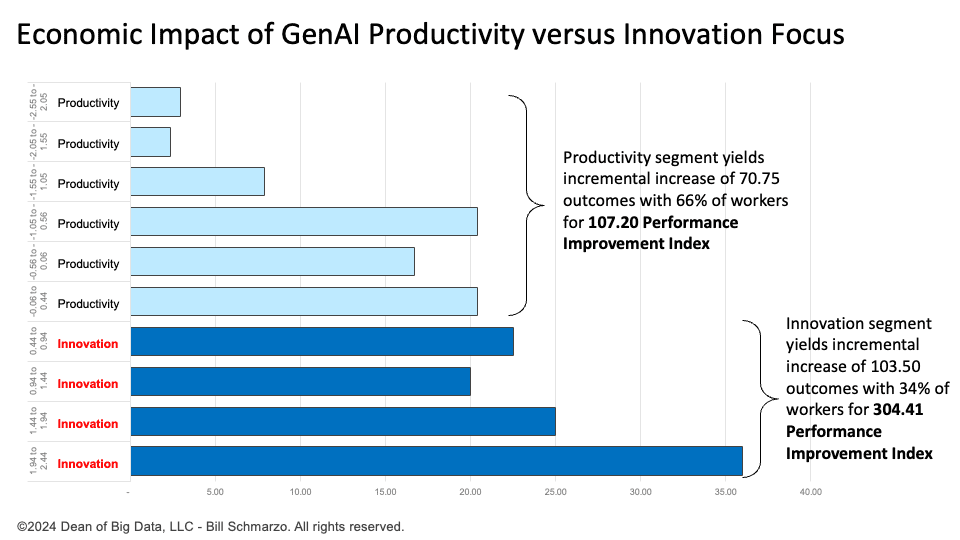
Figure 2: Summary of GenAI Productivity versus Innovation-driven Increase In Outputs
Quantifying the GenAI Economic Impact Summary
The blog discusses the transformative potential of Generative AI (GenAI) in driving organizational performance. It contrasts two distinct phases of GenAI-driven performance improvements: the “Productivity” phase, focused on enhancing average worker efficiency, and the “Innovation” phase, which empowers high performers to achieve breakthroughs by reimagining business processes, models, and customer engagement.
What we found surprising about this investigation was:
- There are significant organizational performance improvement opportunities just by raising your below-average workers’ performance to the average worker’s level. The ability to create content more quickly has benefits. However, it needs to be clarified how differentiated and sustainable those benefits are in a world where everyone can access the same GenAI tools.
- More importantly, the most significant improvements in organizational performance come from empowering top-performing employees to use their natural curiosity and imagination to explore creative uses of GenAI. This enables identifying and assessing opportunities for creating new sources of customer, product, service, and operational value.
Sustainable customer differentiation and competitive advantage are achieved by empowering top performers, using their deep domain expertise and advanced skills (data science, design thinking, data economics) to create new sources of differentiated value rather than relying solely on the GenAI tool.
==========
Appendix A: Innovation-driven GenAI Examples
High-performing employees can innovatively leverage Generative AI (GenAI) to execute work beyond traditional productivity improvements. Based upon the blog “Nine Categories of Innovation-Driven Prompt Engineering,” here are examples of the creative work that high-performing employees could undertake using innovation-driven GenAI prompts:
- Explore and Generate Ideas. Innovators can examine upcoming trends, innovations in different industries, and changes in customer behavior to identify new product and service opportunities. For instance, they can develop ideas for new target markets or create groundbreaking products by identifying patterns across diverse industries.
- Assumption Validation and Risk Assessment. Innovators can stress-test their strategic assumptions, identifying blind spots, possible pitfalls, and overlooked risks. For example, they might explore the limitations of a new product launch strategy by generating counterfactual scenarios or identifying market conditions that could disrupt their plans.
- Strategic Planning and Decision Making. Innovators can generate and compare strategic options based on various criteria, such as potential ROI, market fit, and resource allocation. For instance, they might use AI-driven scenario analysis to evaluate the impact of entering a new market or launching a new product line, helping them prioritize initiatives that offer the highest strategic value.
- Scenario Analysis and Forecasting. Innovators can create detailed forecasts of market trends, customer behavior, and competitor actions. For example, they might model the impact of technological disruptions on their industry or evaluate how changing regulations could affect their operations.
- Innovation Execution and Implementation. Innovators can design detailed execution plans, identify required resources, and establish key performance indicators (KPIs) to track progress. For example, they might create a roadmap for integrating AI into existing business processes or develop a project management plan for a significant product launch.
- Customer and Market Insights. Innovators can analyze vast customer data, identify emerging trends, and generate insights that can be used to design new products that address unmet customer needs or tailor marketing campaigns to resonate with specific customer segments, increasing customer loyalty and market share.
- Organizational Change and Culture. Innovators can design programs that empower employees to contribute to innovation, such as idea competitions or collaborative workspaces. They could recommend organizational changes that remove innovation barriers, such as reducing hierarchical layers or creating cross-functional teams focused on rapid experimentation.
- Technology and Capability Development. Innovators can identify and prioritize emerging technologies that align with the organization’s strategic goals. For instance, they might explore the potential of quantum computing, blockchain, or advanced AI to disrupt their industry and integrate these technologies into their operations to gain a competitive edge.
- Competitive Analysis and Positioning. Innovators can conduct in-depth competitive analysis, identifying gaps in the market or areas where competitors are vulnerable. They could use AI-driven insights to refine their value proposition, ensuring their offerings stand out in a crowded marketplace and appeal to target customers.
These projects empower high-performing employees to leverage GenAI in ways that go beyond mere productivity enhancements, enabling them to drive meaningful innovation and strategic growth within their organizations.
[1] We tested other GenAI tools and found that Google Gemini gave us the most explainable assessment.
%20Quantify%20the%20Economic%20Impact%20of%20GenAI)
I ran my own simulation from first principles and it agreed with the first hypothesis and partially with the second:
** Hypotheses and Status**
Hypothesis 1. Focusing on GenAI’s innovative use rather than productivity use results in a 3x improvement in outcomes.
Validated:
– Scenario testing confirms that an innovation-first focus significantly boosts outputs for top-performing employees, achieving up to a 3x improvement in innovation metrics (e.g., patent filings, prototype development).
– High adoption levels (90%) and comprehensive training amplify these gains in innovation-intensive sectors like R&D and creative industries.
– Narrative:
“GenAI thrives as a catalyst for innovation when strategically integrated into roles that demand creativity, problem-solving, and strategic thinking. The most significant benefits emerge when the top 30% of employees are empowered to explore complex tasks with robust AI augmentation.”
Hypothesis 2. GenAI can bring below-average performers closer to average and marginally improve average performers, but the real advantage lies in its innovative focus on empowering the top 30% of employees.
Partially Validated:
– – Below-average performers see 18-20% productivity gains, effectively narrowing the performance gap by up to 44%.
Average performers experience marginal improvements (~9-12%), aligning with the hypothesis.
– Top 30% employees achieve 25-36% innovation boosts, demonstrating that innovation remains the core value driver.
– Narrative:
“GenAI serves as an equalizer for underperformers, closing the performance gap and elevating baseline productivity. However, the true potential of GenAI lies in enabling high performers to drive innovation, reinforcing the strategic value of an innovation-first deployment model.”
** Key Insights Supporting the Narrative**
Innovation-First vs. Productivity-First Deployment:
Scenarios show that innovation-first deployments yield transformational results in strategic tasks for top 30%, while productivity-first approaches primarily benefit below-average employees in routine tasks.
Performance Convergence:
GenAI reduces disparities in task efficiency, but without innovation-focused strategies, average and top performers may experience diminishing returns.
Sector-Specific Impact:
The most impactful gains are observed in sectors with high creative or strategic task demands (e.g., R&D, professional services).
Training as a Key Enabler:
Comprehensive training ensures both productivity and innovation gains, preventing underutilization of GenAI capabilities.