“Speak Quantum Friend and Enter” . Today, I uploaded to github my new software library called Entanglish (open source, under BSD license). Entanglish is a Pyt...
Below are some extracts from an interesting Quora discussion on this topic. Quotes: The gradient descent way: You look around your feet and no farther than a few meters f...
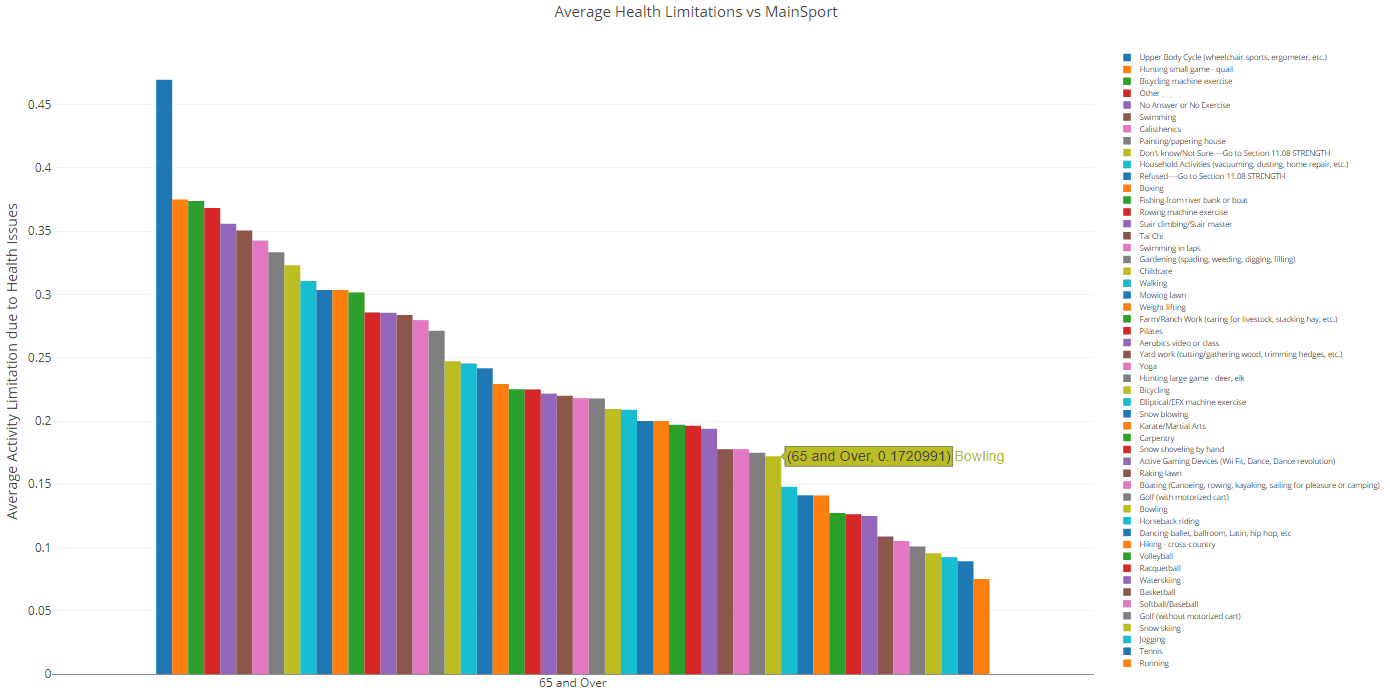
Diving into CDC Behavioral Risk Factor data using Pivot Billions to learn what exercise behaviors are associated with improved health. Motivating yourself to go outside a...
Measuring the similarity between texts is a common task in many applications. It is useful in classic NLP fields like search, as well as in such far from NLP areas as med...
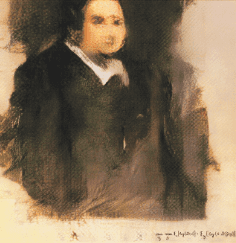
Introduction Edmond de Bellamy, from La Famillie de Bellamy created by Obvious, a French group; was auctioned and sold for $432,500 at Christie´s, a British auction hous...
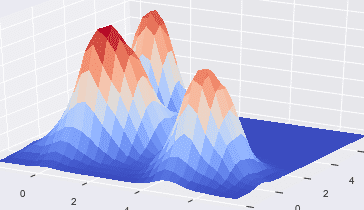
Data scientists and predictive modelers often use 1-D and 2-D aggregate statistics for exploratory analysis, data cleaning, and feature creation. Higher dimensional aggre...
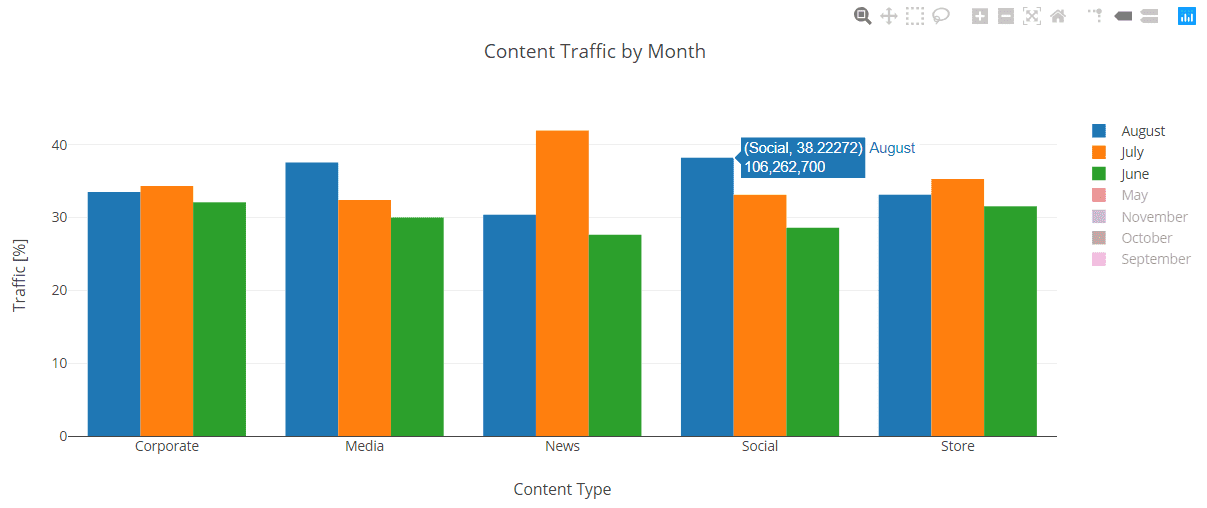
The chart is a visual representation of data in a clear and simple manner. This type of visualization is often used to increase the level of comprehension, especially in ...
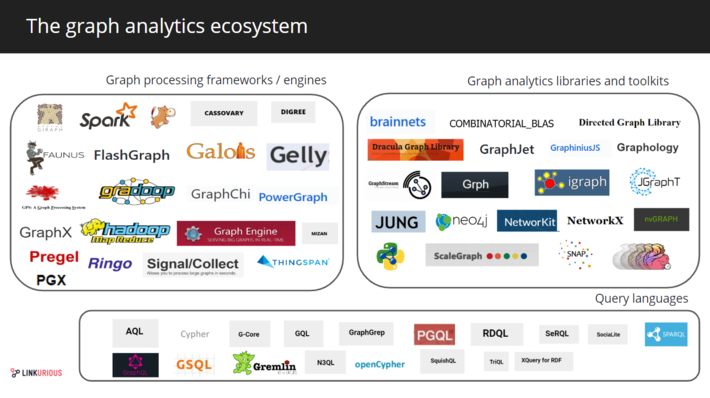
Read part 1 – The graph database landscape The graph analytics landscape 2019 Graph analytics frameworks consist of a set of tools and methods developed to extract ...
Artificial intelligence has been fascinating to the human imagination since the term was first used by the first science fiction writers. The roots of the concept of R...
Analyzing campaign efficiency with Pivot Billions Managing data just keeps getting tougher. The more we think we’ve gotten a handle on our data the more it grows and be...