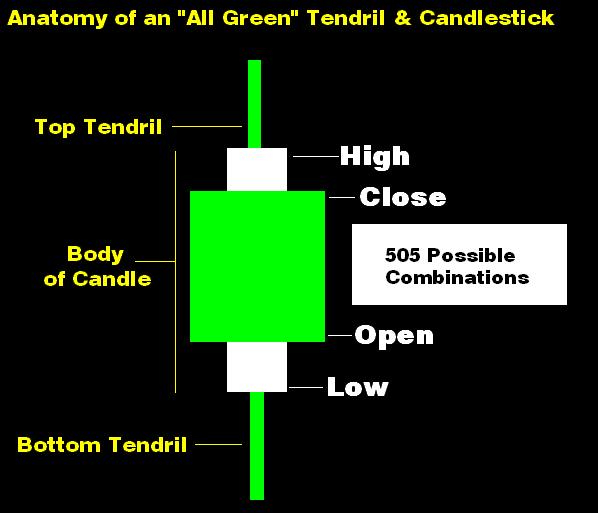
A candlestick chart is sometimes used by stock market technicians to make trading decisions. Each candlestick graphically depicts the following prices simultaneously: ...
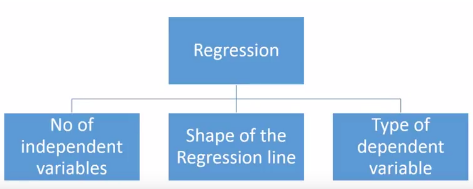
This article was posted by Sunil Ray. Sunil is a Business Analytics and Intelligence professional with deep experience in the Indian Insurance industry. Introduction Lin...
Summary: Before starting to develop an AI strategy, make sure your team understands the limits of what is reasonable today, as well as incremental improvements that mig...
Sales prediction is an important part of modern business intelligence. First approaches one can apply to predict sales time series are such conventional methods of fore...
Summary: Now that we’ve detailed the four main AI-first strategies: Data Dominance, Vertical, Horizontal, and Systems of Intelligence, it’s time to pick. Here we ...
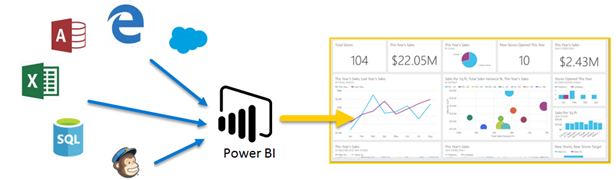
Guest blog by Robert Breen. What is PowerBI? Power BI is a collection of software services, apps, and connectors that work together to turn your unrelated sources of...
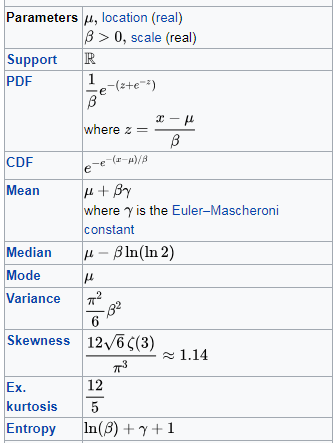
Guest blog by Yoel Zeldes. This post describes: what the Gumbel distribution is how it is used for sampling from a discrete distribution how the weights that affect the ...
Semantics is an area of linguistics and natural language processing to help make sense and meaning of the world around us. In visual analytics, using principles of semant...
Bill is the Editorial Director for Data Science Central, and President and Chief Data Scientist at Data-Magnum, providing predictive analytics and big data infrastructur...
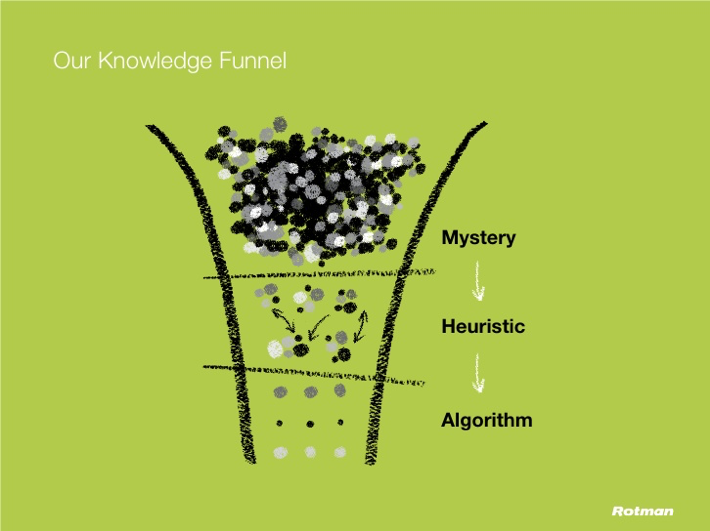
Okay, that may be the most complicated title that I’ve ever read, but here’s the point of that title: Most people don’t know what they already know. Maybe spun ...