Introduction With the growth of Data science in recent years, we have seen a growth in the development of the tools for it. R and Python have been steady languages used b...
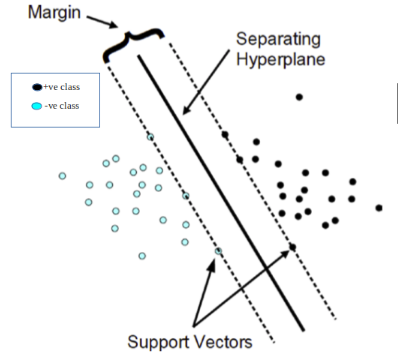
This article was written by Krishna Kumar Mahto. So, three days into SVM, I was 40% frustrated, 30% restless, 20% irritated and 100% inefficient in terms of getting my ...
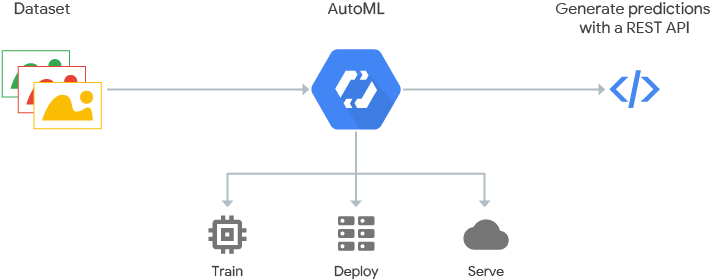
Witnessing the data science field’s meteoric rise in demand across pretty much all industries and areas of scientific research, it’s easy to anticipate efforts to cre...
Last month I had an honor to participate in data science project reviews for the new graduates of General Assembly’s Data Science Immersive program. In the span of ...
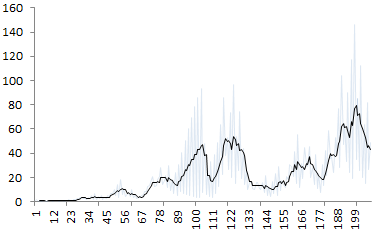
Determining the number of clusters when performing unsupervised clustering is a tricky problem. Many data sets don’t exhibit well separated clusters, and two human ...
Determining the number of clusters when performing unsupervised clustering is a tricky problem. Many data sets don’t exhibit well separated clusters, and two human ...
The Digital Shopfloor: Industrial Automation in the Industry 4.0 Era looks like a great free open access book by John Soldatos, Oscar Lazaro and Franco Antonio Cavadini...
Machine Learning is changing the ways industries do business – Healthcare, Manufacturing, Retail and Food and Beverage will never be the same again. Banking and Fin...
devices are going to number around 75.44 billion by 2025. The increase in IoT based technology and development support has influenced many fields to start implementing Io...
Hello Everyone, I’ve just recently joined this site. Firstly, I would like to share with you all a free and open-sourced tool that I have published on github.com f...