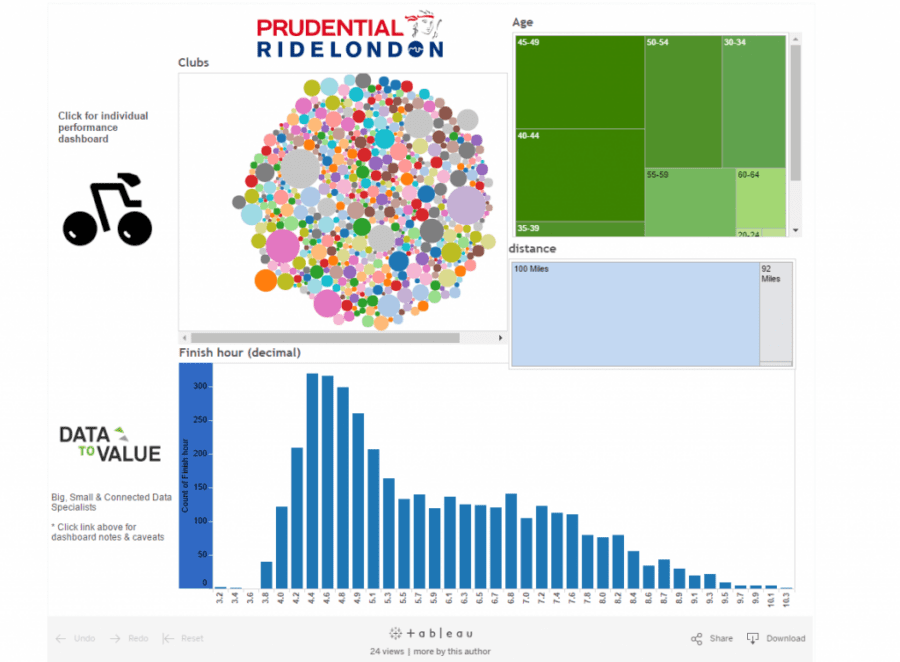
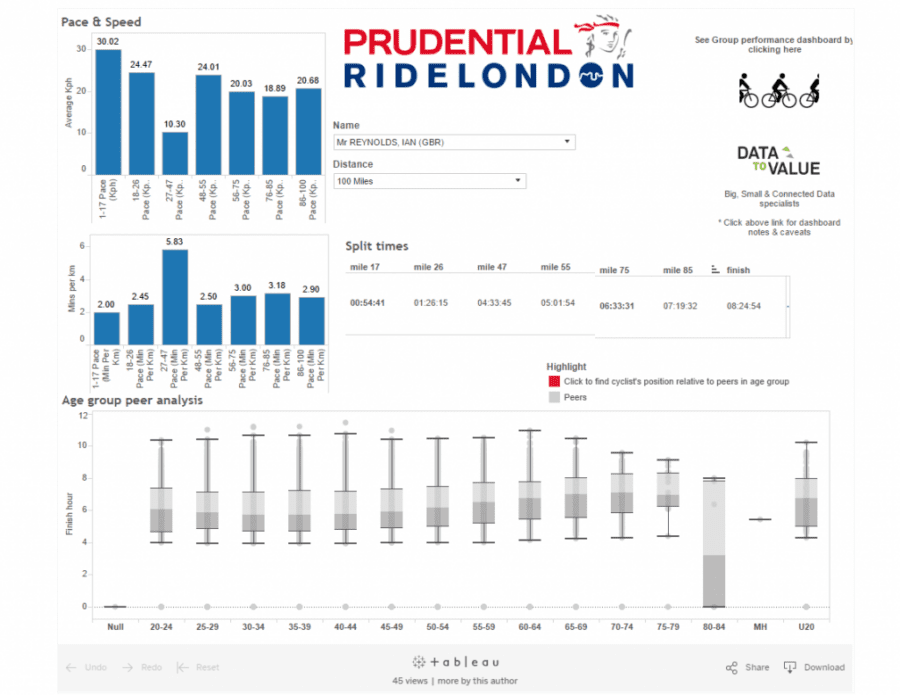
Congratulations to all Ride London participants! We enjoyed watching and supporting Prudential Ride London 2016 in the sunshine and in response to numerous requests to repeat the dashboard we produced in 2015 we are pleased to say we have created 2 dashboards for 2016:
- An individual performance dashboard covering split times, average kph, pace and peer group position for age groups.
- A group performance dashboard breaking down finish times by club, age and distance.
We hope people enjoy taking a slightly different look at the results. Its probably worth mentioning a few caveats however:
- The results obviously have nothing officially to do with Prudential Ride London and are based on a snapshot from a couple of days after the event. Thus they may be out of date, for official up to date results please go to the official website.
- Some cyclists were diverted. These times are covered by the visualisation but are not separated out making like for like split times in some cases not possible.
- Given the data available we had to recalculate pace and average kph stats. These are slightly out of kilter from official stats we believe due to different decimal places in rounding.


