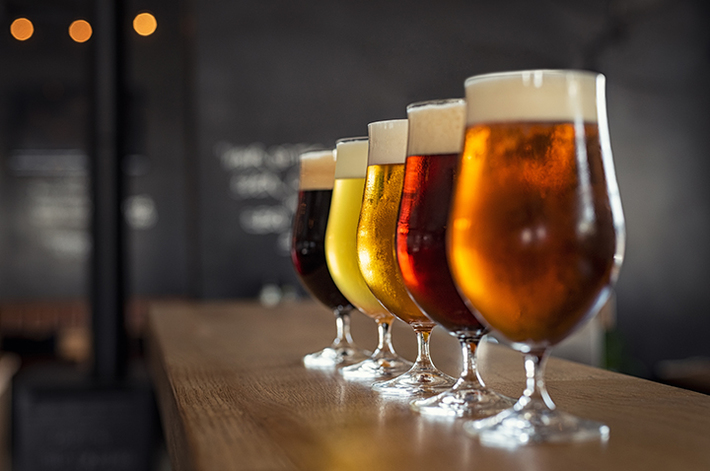
Beer drinkers today are more spoiled for choice than ever before. From suburban supermarkets to big city bodegas, cooler cases are filled to bursting: IPAs, pilsners, stouts, lagers, goses, and countless other varieties and variations.
Beer culture is ascendant around the world and in the US, totalling over a half-trillion (USD) in sales globally. While COVID-related restaurant closures dealt a blow to the beer industry, 2021 saw a 2.5% bump in beer sales and strong international growth is projected through 2025. And technology is helping drive that growth: Brewers are using new equipment and techniques, social media is connecting brewers and audiences, and the use of data is opening new possibilities, as well.
But with all that growth and potential, what happens when you get to the shop and they dont have the beer you want? Sisense client RetailZoom specializes in helping supermarkets and suppliers do more with data. They took their massive stock of data and dug deep into the behaviors of beer buyers with an eye towards understanding what brands people turn to when their preferred beer isnt available.
What they learned is fun, informative, and could be the future of shelf stocking for retailers of all kinds, regardless of what theyre selling. Read on to learn about how infusing actionable intelligence from huge supplies of analyzed data is helping revolutionize the supermarket beer experience.
Data unlocks buyer behaviors
Whether they realize it or not, most shoppers have a preference for a specific brand of variety of whatever good theyre looking for. Beer, cigarettes, and various packaged goods tend to elicit higher levels of brand or variety loyalty (Im an IPA person, or Get me a six of Corona, etc.). But while some drinkers might not be too picky within the same general category (Any IPA is fine.), what do they do when their first choice isnt in stock?
RetailZoom wanted to understand the real-world behaviors of beer drinkers when their professed preference is unavailable. Do they stay within the same category? Is price a factor? What about visibility and the layout of the beer case?
Data and Analytics Manager Constantinos Mavrommatis headed up RetailZooms analysis of beer sales statistics, which the company had gathered from 95% of the supermarkets in its native Cyprus. This point-of-sale data came from loyalty card holders and included their beer purchasing patterns, amounts spent, item combinations bought together, and crucially what their next go-to beer was if a particular item was out of stock.
The research product took over two years and resulted in significant substitution patterns for 120 categories. Unsurprisingly, loyalty is a huge factor, which Constantinos says retailers need to be wary of or pay the consequences:
If you exclude a product, you upset these people and consequently end up losing more market share for your supermarket.
Conversely, using this data to understand drinkers preferences could help improve in-store placement, inventory management, customer recommendations, and more. Armed with actionable intelligence about these preferences, supermarket managers could plan their beer orders more strategically, ensuring that the leading candidates for their main categories are all present in sufficient amounts. Floor staff could also use substitution info to guide shoppers towards a popular choice when their desired brand is unavailable.
Simpler beer substitution, better sales for stores
The best data and analytics in the world are worthless if not presented in a format thats easy for people to use and understand. RetailZoom relied on the Sisense analytics platform to help them display complex information and infuse actionable intelligence into workflows for many other projects. Putting the right data in front of the right person at the right time is the future of work and of analytics; its also key to how Sisense works.
RetailZooms resulting beer substitution dashboard is an intuitive way for supermarket teams to understand the most-popular replacements for a selected beer. Manufacturers, retailers, bartenders, or drinkers click through the UI to easily explore options without having to confront the underlying algorithms and a mammoth beer dataset analytics are most valuable when users of all technical skill levels can make sense of them.
For Constantinos, the right visualizations were vital to the success of this project: We have 21 statisticians, we write 10 different programming languages, but without the presentation of the data we would probably be shut down today.
But just looking good wasnt enough Constantinos wanted to confirm that the results actually made sense and worked in the real world. Did their millions of data points accurately represent what real beer drinkers actually wanted?
We wanted to get a feeling for ourselves, Constantinos said. So I took the IPA beer I usually drink and tried the substitutions the system proposed, and it actually worked.
Other members of the RetailZoom team had similar results. Its telling that outside observers who learn about the research project doubt its findings, but Constantinos counters naysayers with hard numbers:
When youre checking 100,000 people and 50,000 switch¦ then its a fact, whether you accept it or not.
Beyond beer: Analytics for cigarettes and more
Beer data is just the start for RetailZoom. Constantinos says his team can build tools to predict substitutions for virtually any consumer product they have data on. The success of the beer substitution project has opened doors for a variety of other industries, including cigarettes, gambling, and energy drinks. An even larger assortment-optimization project could even touch on vital industries like healthcare.
Every industry can benefit from analytics that help them understand audience behaviors and which serve up those insights in easy-to-understand ways. Putting actionable insights in the right hands at the right place and time, like RetailZoom has, is the future of analytics and the future of work.
A version of this story appeared on the Sisense Blog.
