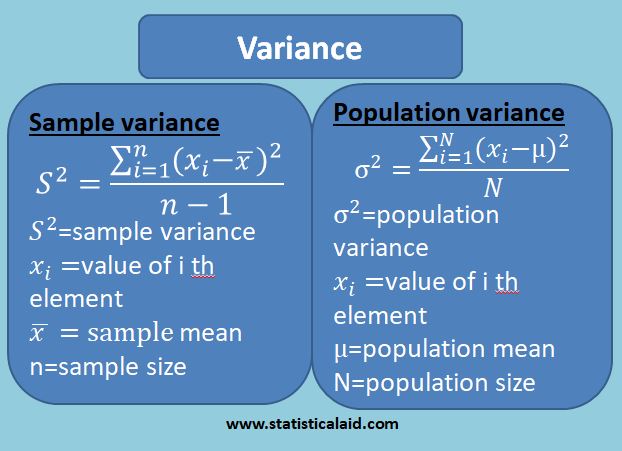
Image Source: Statistical Aid
Variance is one of the best measures of dispersion which measure the difference of all observation from the center value of the observations.
Population variance and standard deviation
The average of the square of the deviations taken from mean is called variance. The population variance is generally denoted by Ï2 and its estimate (sample variance) by s2. For N population values X1,X2,…,XN having the population mean μ, the population variance is defined as,
Where, μ is the mean of all the observations in the population and N is the total number of observations in the population. Because the operation of squaring, the variance is expressed in square units and not of the original units.
So, we can define the population standard deviation as
Thus, the standard deviation is the positive square root of the mean square deviations of the observations from their arithmetic mean. More simply, standard deviation is the positive square root of Ï2.
Sample variance
In maximum statistical applications, we deal with a sample rather than a population. Thus, while a set of population observations yields a Ï2 and a set of sample observations will yield a s2. If x1,x2,…,xn is a set of sample observations of size n, then the s2 is define as,
Properties
Effect of changes in origin: Variance and standard deviation have certain appealing properties. Let each of the numbers x1,x2,…,xn increases or decreases by a constant c. Let y be the transformed variable defined as,
where, c is a constant.
Finally we get that any linear change in the variable x does not have any effect on its Ï2. So, Ï2 is independent of change of origin.
Effect of changes in the scale: When each observation of the variable is multiplied or divided by a certain constant c then there occur changes in the Ï2.
So, we can say that changes in scale affects and it depends on scale.
Uses of variance and standard deviation
A thorough understanding of the uses of standard deviation is difficult for us as this stage, unless we acquire some knowledge on some theoretical distributions in statistics. The variance and standard deviation of a population is a measure of the dispersion in the population while the variance and standard deviation of sample observations is a measure of the dispersion in the distribution constructed from the sample. It can be the best understood with reference to a normal distribution because normal distribution is completely defined by mean and standard deviation.


