I’d like to personally invite our global community of Data Scientists to participate in this week’s DSC challenge. You are invited to create your own data video: we provide simple instructions on how to do it. All submissions of acceptable quality will be featured on DSC, reaching our entire community of just over 1M members. Each participant will receive a free copy of my (Vincent Granville’s) first book featuring earlier videos, signed by me.
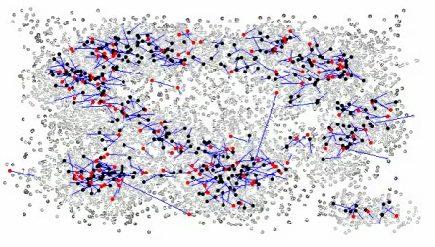
Extract (frame) from one of our data videos
The efforts required to succeed and to be featured are very reasonable. This weekly challenge offers a community effort to learn and share some new techniques that may even be useful for your career. Utilizing open source software such as R, you will find that your time and effort to produce the requested contribution will be minimal, and a worthwhile exercise and a fun experience to share among your peers here on DSC.
Below are links to sample videos including explanation and source code – typically less than 20 lines.
Some Additional Details:
To participate, simply produce a data video, featuring an analysis or data flow (visual representation) based on some data set. Typically a video can last 30 seconds or more, with 200 frames of more, each frame representing a chart or map at a given time, representing a phenomenon evolving over time, and based on a data set. You can even use our own data sets (no need to create one!) and re-use our R source code to produce the video. The simplest version consists of just about 5 lines of code. You may even find that your submission might impress your boss, your colleagues, and definitely our community of data practitioners around the globe.
You are also free to choose to do it the “hard way,” and use your own software and your own data sets. Extra points awarded.
Criteria:
The following factors will be taken into account when featuring videos:
- Professionalism versus amateur-looking videos.
- The video conveys a useful message; either useful from a business or economic standpoint or educational in nature. While we love “eye-candy” we’re looking for a combination of both
- Quality of the code and/or data set
- Originality
How to get started:
The easiest way is to look at sample videos that we have produced in the past or described in our book (pages 118-122): all are well documented, including code to produce the underlying data sets. It is also an opportunity to learn 2 or 3 basic R commands to play with all sort of colors to produce amazing “flowing charts” with millions of colors, without being an expert in image generation. But you can do it in Python or Java if you prefer.
Here are four examples, some are also available on YouTube. When you click on the links, you will be able to see the videos, source code, data set and explanations:
- The most basic example
- A little more involved simulating clusters evolving over time, a bit like the formation of galaxies (the above picture is from that video)
- Random walk in two dimensions, illustrating stock market patterns
- Rogue wave generator – related to an MIT article to predict rogue waves; initially presented as simulated belly dancing as the mechanism is identical
Videos can be uploaded on Youtube, and will be featured (as well as source code, data set, and comments) on DSC.
Send your Video Links directly to me: [email protected]. I look forward to receiving your submissions.
Good luck and Have Fun!
Vincent Granville

