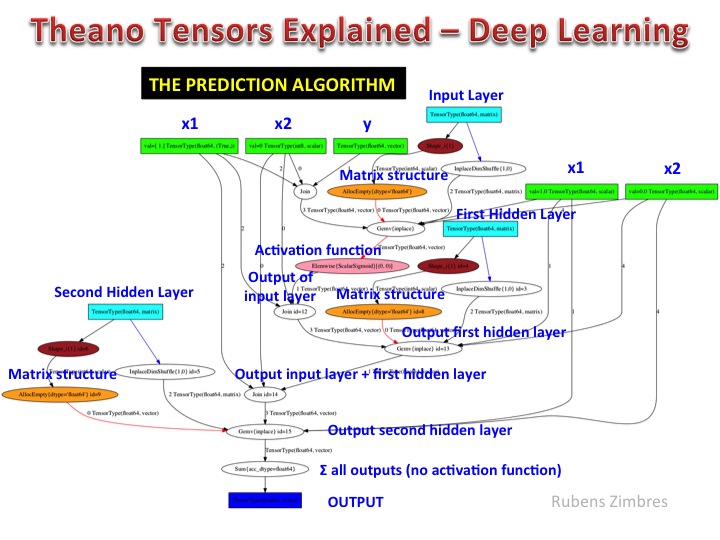
Lately I’ve been doing some experiences with Theano and Deep Learning. One thing that I really thought could help is to understand the workflow of a Theano algorithm through visualization of tensors’ connections. After developing the model, I printed the prediction algorithm for a deep learning Neural Net with 2 hidden layers, 2 inputs X1 and X2, and a continuous output Y. I used Graphviz and pydot to generate the graphic with this line of code:
theano.printing.pydotprint(prediction, outfile=”/Volumes/16 DOS/Python/prediction.png”, var_with_name_simple=True)
It looks like this:

