By Faruqui Ismail and Nooka Raju Garimella

Reporters with various forms of “fake news” from an 1894 illustration by Frederick Burr Opper
We’ve always pictured the rise of artificial intelligence as being the end of civilization, at least from watching movies like ‘The Terminator – Judgement Day’. We could not have imagined that something as insignificant as misinformation, would lead to the collapse of organisations; beginning wars and even mass suicides.
The definition of what we regard as “Fake” news has a broad spectrum. Consider an article published in the early 2000’s, which was true at the time. That same article being published now, excluding the date… giving it an appearance of recently occurring events. Would be regarded as “misinformation” or “Fake”.
In summary, we identified a need to identify the truth from misinformation and created a product that would help us do that. We began by creating 2 robots using BeautifulSoup (bs4) and Selenium, these robots extracted data from various fake news sites according to Wikipedia. We then supplemented this data with GitHub data (refer to acknowledgements).
Post cleaning and reworking the data using some Natural Language Processing(NLP) techniques, we proceeded to create features. By asking the question, what makes a fake news article different from a non-fake news article? We agreed on the following:
- The % of punctuation’s in an article (by ‘over-dramatizing’ events people will use more punctuation’s than usual)
- The % of capital letters in an article (once again, this takes care of e.g. “DID YOU KNOW”)
- If the article came from a website known for publicizing sensational/fake stories as tracked by Wikipedia
- Finally, we looked at poor sentence construction. Sentences constructed too long are usually indicative of someone who is not a journalist writing the article
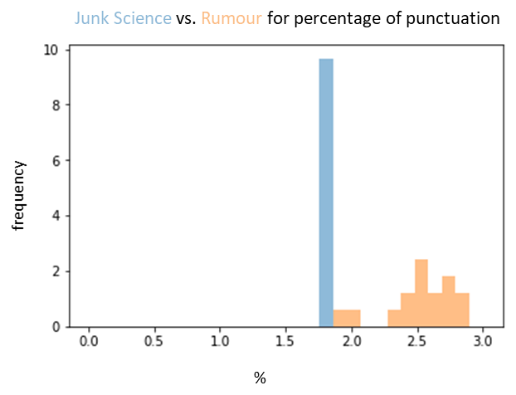
To increase the overall accuracy of the final prediction. These features were then checked to see if they were not too correlated, and that the sub contents of some of these features did not overlap e.g.:
Feature Analytics – [image] (image 1.0)

To avoid over-fitting of the model, feature transformation was done. This helped normalize the feature which helped prevent over-fitting. This visual (image 1.1), is an example of the transformation done of % of upper case letters to the new article:
Feature Normalization – [image] (image 1.1)

These minor changes increased the final prediction precision by 9.63%.
Once these features were created, we dove into NLP. We removed all stop words; tokenized and stemmed the data; excluded all punctuation’s from the text etc.
Considering prediction times, preference was given to Porter stemming over Lemmatizing, NLP generally creates a massive quantity of features.
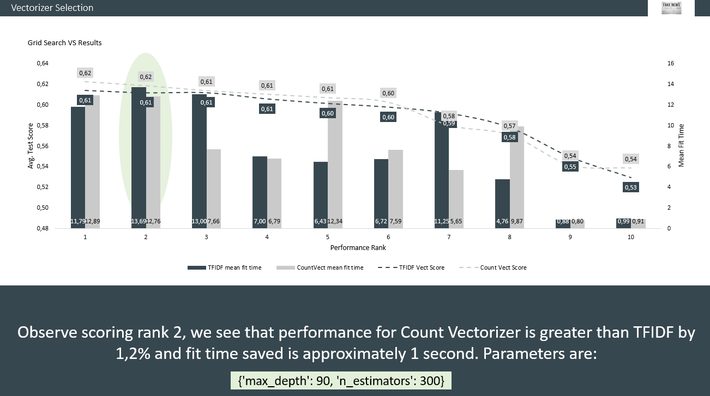
Again, balancing precision with the time it takes to run the program was a key consideration on which vectorizer to use. GridSearchCV to the rescue. We ran TFIDF Vectorizer as well as a Count vectorizer on certain parameters and recorded their fit times and prediction scores:
Choosing the most efficient vectorizer [image] (image 2.0)
RandomForest was a strong candidate for our prediction, hence we used it. To identify the best possible parameters in the machine learning algorithm. A grid was constructed which provided the optimal n_est and depth which would yield the highest precision, accuracy and recall.
Parameter Selection – [table] (table 1.0)
|
Est: 50 |
Depth: 10 |
Precision: 0.6921 |
Recall: 0.4833 |
Accuracy: 0.4769 |
|
Est: 50 |
Depth: 30 |
Precision: 0.8405 |
Recall: 0.8166 |
Accuracy: 0.7923 |
|
Est: 50 |
Depth: 90 |
Precision: 0.8479 |
Recall: 0.8416 |
Accuracy: 0.8461 |
|
Est: 50 |
Depth: None |
Precision: 0.8143 |
Recall: 0.7916 |
Accuracy: 0.8076 |
|
Est: 100 |
Depth: 10 |
Precision: 0.7159 |
Recall: 0.6416 |
Accuracy: 0.6153 |
|
Est: 100 |
Depth: 30 |
Precision: 0.8352 |
Recall: 0.8 |
Accuracy: 0.7923 |
|
Est: 100 |
Depth: 90 |
Precision: 0.8685 |
Recall: 0.8583 |
Accuracy: 0.8615 |
|
Est: 100 |
Depth: None |
Precision: 0.8936 |
Recall: 0.9166 |
Accuracy: 0.9076 |
|
Est: 150 |
Depth: 10 |
Precision: 0.7066 |
Recall: 0.6 |
Accuracy: 0.5615 |
|
Est: 150 |
Depth: 30 |
Precision: 0.8398 |
Recall: 0.8333 |
Accuracy: 0.8230 |
|
Est: 150 |
Depth: 90 |
Precision: 0.8613 |
Recall: 0.8583 |
Accuracy: 0.8461 |
|
Est: 150 |
Depth: None |
Precision: 0.8786 |
Recall: 0.8833 |
Accuracy: 0.8769 |
This entire project was then packaged into a web framework using Django. The view showed whether the data was e.g. unreliable, junk science, fake, true etc.
Authors and Creators:
Acknowledgements:
GitHub data: https://github.com/several27/FakeNewsCorpus
Wikipedia fake news list: https://en.wikipedia.org/wiki/List_of_fake_news_websites
