This article focuses on cases such as Facebook and protein interaction networks. The article was written by By Paul Scherer (paulmorio) and submitted as a research paper to HackCambridge. What makes this article interesting is the fact that it compares five clustering techniques for this type of problems:
- K Clique Percolation – A clique merging algorithm. Given a set kk, the algorithm goes on to produce kk clique clusters and merge them (percolate) as necessary.
- MCode – seed growth approach to finding dense subgraphs
- DP Clustering – seed growth approach to finding dense subgraphs similar to MCODE but has an internal representation of weights in the edges, and the stopiing condition is different.
- IPCA – Modified DPClus Algorithm which focuses on maintaining the diameter of a cluster (defined as the maximum shortest distance between all pairs of vertices, rather than its density.
- CoAch – Combined Approach with finding a small number of cliques as complexes first and then growing them.
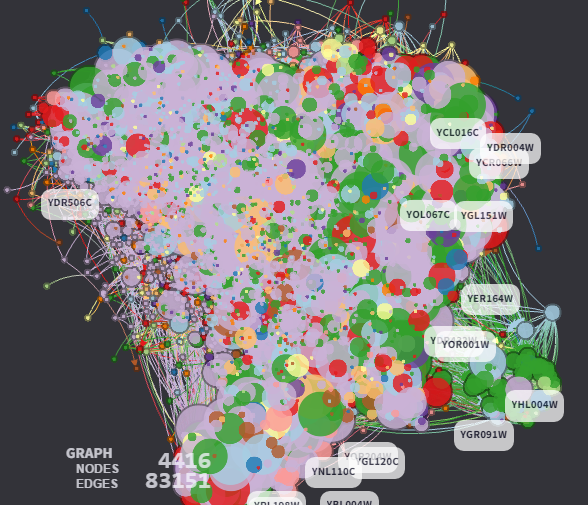
The articles also provides great visualizations such as the one below:
In the original article, these visualizations are interactive, and you will find out which software was used to produce them.
Below is the summary (written by the original author):
Summary
For my submission to HackCambridge I wanted to spend my 24 hours learning something new in accordance with my interests. I was recently introduced to protein interaction networks in my Bioinfomartics class, and during my review of machine learning techniques for an exam noticed that we study many supervised methods, but no unsupervised methods other than the k means clustering. Thus I decided to combine the two interests by clustering the Protein interaction networks with unsupervised clustering techniques and communicate my learning, results, and visualisations using the Beaker notebook.
The study of protein-protein interactions (PPIs) determined by high-throughput experimental techniques has created karge sets of interaction data and a new need for methods allowing us to discover new information about biological function. These interactions can be thought of as a large-scale network, with nodes representing proteins and edges signifying an interaction between two proteins. In a PPI network, we can potentially find protein complexes or functional modules as densely connected subgraphs. A protein complex is a group of proteins that interact with each other at the same time and place creating a quaternary structure. Functional modules are composed of proteins that bind each other at different times and places and are involved in the same cellular process. Various graph clustering algorithms have been applied to PPI networks to detect protein complexes or functional modules, including several designed specifically for PPI network analysis. A select few of the most famous and recent topographical clustering algorithms were implemented based on descriptions from papers, and applied to PPI networks. Upon completion it was recognized that it is possible to apply these to other interaction networks like friend groups on social networks, site maps, or transportation networks to name a few.
I decided to Graphistry’s GPU cluster to visualize the large networks with the kind permission of Dr. Meyerovich. (Otherwise I would have likely not finished on time given the specs of my machine) and communicate my results and learning process
The full version with mathematical formulas, detailed descriptions, and source code, can be found here. For more articles about clustering, click here. This link will give you access to the following articles:
DSC Resources
- Career: Training | Books | Cheat Sheet | Apprenticeship | Certification | Salary Surveys | Jobs
- Knowledge: Research | Competitions | Webinars | Our Book | Members Only | Search DSC
- Buzz: Business News | Announcements | Events | RSS Feeds
- Misc: Top Links | Code Snippets | External Resources | Best Blogs | Subscribe | For Bloggers
Additional Reading
- What statisticians think about data scientists
- Data Science Compared to 16 Analytic Disciplines
- 10 types of data scientists
- 91 job interview questions for data scientists
- 50 Questions to Test True Data Science Knowledge
- 24 Uses of Statistical Modeling
- 21 data science systems used by Amazon to operate its business
- Top 20 Big Data Experts to Follow (Includes Scoring Algorithm)
- 5 Data Science Leaders Share their Predictions for 2016 and Beyond
- 50 Articles about Hadoop and Related Topics
- 10 Modern Statistical Concepts Discovered by Data Scientists
- Top data science keywords on DSC
- 4 easy steps to becoming a data scientist
- 22 tips for better data science
- How to detect spurious correlations, and how to find the real ones
- 17 short tutorials all data scientists should read (and practice)
- High versus low-level data science
Follow us on Twitter: @DataScienceCtrl | @AnalyticBridge


