This article is by Jitesh Shah, a data & stats jockey in perpetual beta, located in Fremont, California. This article includes the data set and Python code.
Wouldn’t it be nice if defects and product failures can be predicted in advance. We’ve got the data on attributes and design features and manufacturing processes that come together and creates that product and we have defect and failure rate data so all we got to do is connect the two and use that to predict which set of features and attributes and processes in combination cause these defects. That was probably a non-trivial endeavor in the past but now with the ability to store and process vast amounts of data (no secret there), no big deal. Plus this could potentially be a goldmine of insights that can allow you to learn and go back to the drawing board and modify design and process attributes that eventually minimize these failures.
Source: original article
So with product failures, it is a pass or a fail thing. That is, there are two binary outcomes just as there is with fraud detection or a credit approval or a customer purchase decision. Either there is a fraud or no fraud, either credit is granted or not, either the customer buys a product or not and modern classification algorithms are a big help in being able to connect the potential causes to that binary outcome. Rows are the instances and columns are the attributes or variables in a given dataset and classification is the process that attempts to differentiate between the two outcome classes. Though the target variable is often binary, it doesn’t have to be and could be any sort of a categorical variable. This process of connecting the two sides starts with passing a training set to the classifier which is going to learn the difference between class 0 and 1. Once that is done, you give the classifier a new observation where you do not know the class in advance and it will predict the right one…hopefully. We’ll deal with grading and rating classifiers in the next post but that is the general theme. And all these model setups in scikit-learn use two methods; fit to train the model and predict to predict the outcome when new observations are thrown at it. That’s pretty much it.
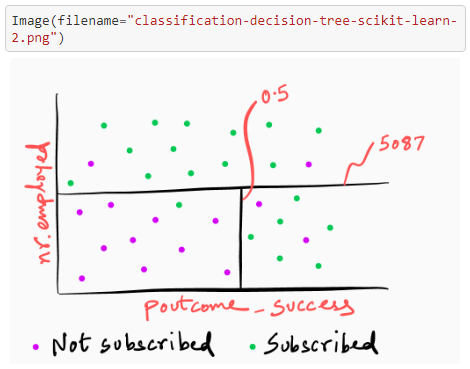
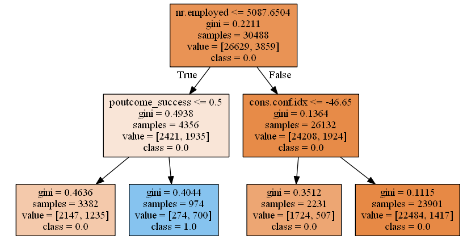
So you train a model and it spits out an outcome and as long as it is doing what you want it to do, you don’t care how it does it. You don’t wanna lift that hood and look under. And that’s fine but sometimes, you want to know how that decision between class 0 and 1 was made. What factors lead the algorithm to decide between the two. Decision-tree is one of those methods where you can interpret the output – you go down the tree and attempt to understand how it came to decide on what falls where. I would have loved to use the dataset I am working on to demo this but then I will get fired so I am going to use this UC Irvine’s bank marketing dataset that is trying to understand a set of features and its link to whether a customer buys or not buy a product that the bank is pitching.
Now that you’ve got the background, time to get a bit dirty..
To access the code, click here.

DSC Resources
- Services: Hire a Data Scientist | Search DSC | Classifieds | Find a Job
- Contributors: Post a Blog | Ask a Question
- Follow us: @DataScienceCtrl | @AnalyticBridge
Popular Articles

