By Reiichiro Nakano.
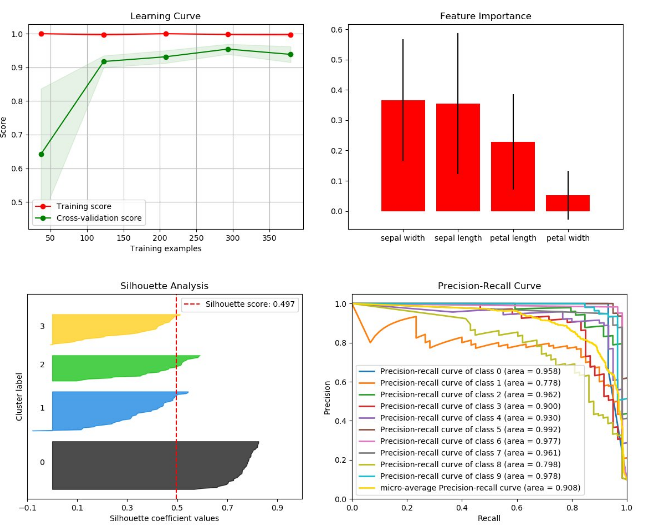
There are a number of visualizations that frequently pop up in machine learning. Scikit-plot is a humble attempt to provide aesthetically-challenged programmers (such as myself) the opportunity to generate quick and beautiful graphs and plots with as little boilerplate as possible.
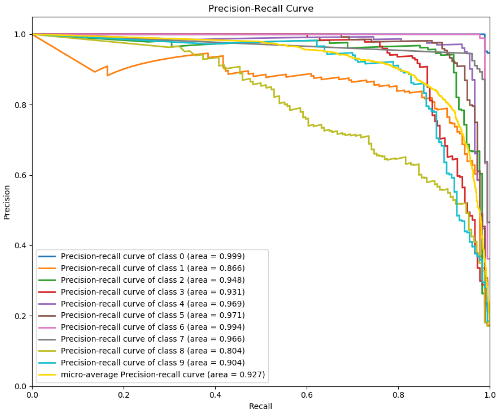
Here’s a quick example to generate the precision-recall curves of a Keras classifier on a sample dataset:
# Import what’s needed for the Functions API
import matplotlib.pyplot as plt
import scikitplot.plotters as skplt
# This is a Keras classifier. We’ll generate probabilities on the test set.
keras_clf.fit(X_train, y_train, batch_size=64, nb_epoch=10, verbose=2)
probas = keras_clf.predict_proba(X_test, batch_size=64)
# Now plot.
skplt.plot_precision_recall_curve(y_test, probas)
plt.show()
Installation is of the sciplot library is simple! First, make sure you have the dependencies Scikit-learn and Matplotlib installed.
Then just run:
pip install scikit-plot
Or if you want, clone this repo and run
python setup.py install
at the root folder.
To access the full resource on Github, with numerous examples and pieces of code, click here.
Top DSC Resources
- Article: Difference between Machine Learning, Data Science, AI, Deep Learnin…
- Article: What is Data Science? 24 Fundamental Articles Answering This Question
- Article: Hitchhiker’s Guide to Data Science, Machine Learning, R, Python
- Tutorial: Data Science Cheat Sheet
- Tutorial: How to Become a Data Scientist – On Your Own
- Tutorial: State-of-the-Art Machine Learning Automation with HDT
- Categories: Data Science – Machine Learning – AI – IoT – Deep Learning
- Tools: Hadoop – DataViZ – Python – R – SQL – Excel
- Techniques: Clustering – Regression – SVM – Neural Nets – Ensembles – Decision Trees
- Links: Cheat Sheets – Books – Events – Webinars – Tutorials – Training – News – Jobs
- Links: Announcements – Salary Surveys – Data Sets – Certification – RSS Feeds – About Us
- Newsletter: Sign-up – Past Editions – Members-Only Section – Content Search – For Bloggers
- DSC on: Ning – Twitter – LinkedIn – Facebook – GooglePlus
Follow us on Twitter: @DataScienceCtrl | @AnalyticBridge


