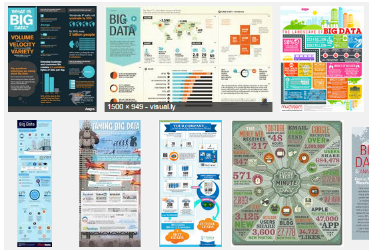
Most of these infographics are tutorials covering various topics in big data, machine learning, visualization, data science, Hadoop, R or Python, typically intended for beginners. Some are cheat sheets and can be nice summaries for professionals with years of experience. Some, popular a while back (you will find one example here) were designed as periodic tables.
For Geeks
- Data Science Wars: R versus Python
- Three periodic tables for data scientists
- Cheat Sheet: Data Visualization with R
- Cheat sheet: data visualization in Python
- Comparing Data Science and Analytics
- Great Machine Learning Infographics
For Business People
- Infographics on data quality
- Unstructured Data: InfoGraphics
- The Data Science Ecosystem in One Tidy Infographic
- Big data and the retail industry: infographics
- Infographics: The Half Life of Data
- What is Hadoop? Great Infographics Explains How it Works
- What is big data – Infographics by Bernard Marr
Infographics Repositories

