We live in an information age where the world of almost every organization revolves around data. Big Data is a field that has been working on the swaths of consumer data for driving valuable outputs.
This is when companies are looking for ways to manage their business process effectively to excel in this intense competition. BetterBuy predicts that companies using Business Intelligence tools and Data Analytics are 5X more likely to make faster business decisions.
With this article, you will get to know some of the top Business Intelligence tools that will help your company make sustainable and profitable decisions.
But before this, let’s have a brief understanding of Business Intelligence in the business world and a world full of mammoth data.
What is a Business Intelligence Tool?
Business Intelligence tools collect, transform, manipulate, and analyze data to help businesses make actionable and meaningful insights.
However, businesses need to decide what kind of BI tool they need for their organization. Selecting a BI tool entirely depends on the key features you want to be included in it, industry type, and the number of people who will access it.
Depending on your business needs, you can opt for the desired BI tool that includes data visualization, visual analytics, interactive dashboarding, and KPI scorecards.
Now, as you know BI tools’ benefits, just dive into some of the top BI tools you need to know.
1. IBM Cognos Analytics
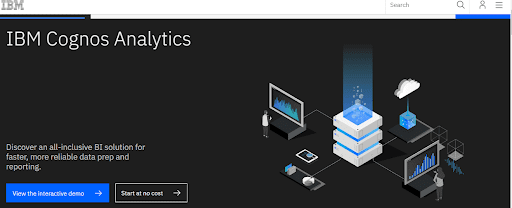
IBM Cognos Analytics is an AI-fueled, cloud-based business intelligence platform that uses AI recommendations in the analytics cycle. The tools help organizations create intuitive reports and dashboards that are used across multiple industries such as retail, healthcare, and eCommerce.
You can easily visualize, analyze and discover hidden patterns because this tool can interpret and present the data in a visualized report. Also, the first-time user does not need any professional expertise to work on it.

Key Features:
- Search mechanism: The search mechanism feature offered by Cognos analytics enables the users to access, discover the recently used content in the software.
- A single data module: The tool acts as a single data module because multiple data sources are joined into a single module, and it does not replace the IT department.
- AI assistant: It enables the users to communicate in plain language, and the AI assistant will provide you with the most suitable visualizations.
2. Looker
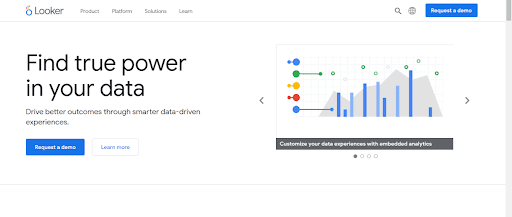
Looker is a browser-based BI (Business tool) that integrates with any SQL database. It is recommended for startups, mid-size, and enterprise-grade businesses. It’s easy-to-use, offers handy visualizations, and has powerful collaboration features like data and reports that can be shared via email or USL or integrated with other applications.

Key Features
- It connects to the user’s SQL database (similar data warehouse).
- The tool provides a proprietary LookML syntax for query optimization.
- It creates real-time visualizations that are available on all devices.
- Provides the users with drag and drop features for dashboard creation
- It can be accessed on the web and mobile devices.
- The tool installs on-premise or in a Looker-hosted cloud.
- It provides the ability to export visualizations for collaboration with others.
3. SAP Business Intelligence
SAP, a BI tool by SAP, offers real-time analytics to the organizations that help them decide. Information researchers, forecasting analysts, gauging investors, tech experts, and information engineers find this tool ideal because it is ideal, smarter, and faster.
Key Features
- It offers various advanced analytics solutions that include machine learning, planning, analysis, and real-time BI predictive analytics.
- It offers data visualization through visuals, reporting, analytics applications, mobile analytics, and office integration.
- It offers loads of functionalities in a single integrated platform.
- Easily integrates with other systems and applications like (e.g., MS Office).
- Requires less coding which is useful in auto charting, and hence it requires less support from the IT team.
4. SAS Business Intelligence
SAS is an acronym for Statistical Analytical System. It is an advanced Business intelligence tool that offers advanced data analysis and handles complex statistical operations. It is a self-service tool that offers its users advanced predictive analytics and allows them to leverage the data and metrics to make informed business decisions.
Key Features
- It offers APIs that provide customization options and ensures high-level data integration and advanced analytics & reporting.
- SAS provides a powerful data analysis ability for analytics and insights.
- It enables self-integration along with an analytics pipeline.
- It allows the users to access the data from 60+ data sources like PC files, RDBMS, Amazon Redshift, Hadoop, and other data warehouse appliances.
- Provides an interactive, self-service, easy-to-use interface for profiling, cleaning, and blending data.
- It enables full integration with the help of an analytics pipeline.
- the tool provides an integrated environment for data discovery, self-service, and world-class analytics.
- It provides the users access to advanced analytic capabilities without coding — correlation, forecasting, decision trees, text analytics, and more.
5. Tableau
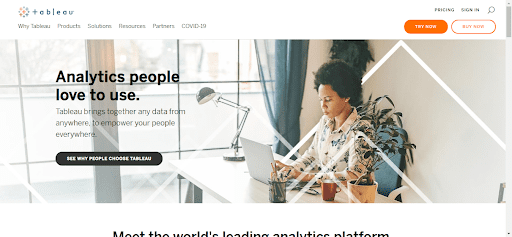
Tableau is the most common BI tool used in many organizations. It is a powerful data visualization tool used in BI these days. Biggies like Verizon, PepsiCo, and Coca-Cola use Tableau as their BI tool to leverage the data and make informed business decisions.

Key Features
The tool provides worksheets and visualization dashboards that implies raw data into an understandable format, cleaning data and identifying underlying trends and patterns.
- Offers a wide range of features and clientele.
- Gets easily installed on Tableau Cloud, public cloud, on-premise.
- It allows access on mobile devices and websites.
- Delivers intuitive, self-service analytics for users without technical knowledge
- It integrates data from sources like cloud-based and on-premise.
- Creates real-time visualizations in a few clicks.
Conclusion
Data is all around us, and Big Data is there for all its answers. Companies have now realized that BI tools are the must-have for their organizations as it helps them predict the future performance.
Here, I have provided you with the best BI tools that will make the company’s data management more stable, cohesive, agile, and predictable. But, before selecting a perfect BI tool for your organization, you need to get in touch with the best software consulting company that will help you with the key features you need to include in it.
