
These Fourier series can be considered as bivariate time series (X(t), Y(t)) where t is the time, X(t) is a weighted sum of cosine terms of arbitrary periods, and Y(t) is the same sum, except that cosine is replaced by sine. The orbit at time t is
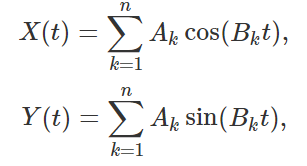
where n can be finite or infinite, and Ak, Bk are the coefficients or weights. The shape of the orbit varies greatly depending on the coefficients: it can be periodic, smooth or chaotic, exhibits holes (or not), or fill dense areas of the plane. For instance, if Bk = k – 1, we are dealing with standard Fourier series, and the orbit is periodic. Also, X(t) and Y(t) can be viewed respectively as the real and imaginary part of a function taking values in the complex plane, as in one of the examples discussed here.
The goal of this article is to feature two interesting applications, focusing on exploratory analysis rather than advanced mathematics, and to provide beautiful visualizations. There is no attempt at categorizing these orbits: this would be the subject of an entire book. Finally, a number of interesting, off-the-beaten-path exercises are provided, ranging from simple to very difficult.
The orbit is always symmetric with respect to the X-axis, since Y(-t) = –Y(t).
1. Application in astronomy
We are interested in the center of gravity (centroid) of n planets P1, …, Pn of various masses, rotating at various speeds, around a star located at the origin (0, 0), in a two-dimensional framework (the ecliptic plane). In this model, celestial bodies are assumed to be points, and gravitational forces between the planets are ignored. Also, for simplification, the orbit of each planet is circular rather than elliptic. Planet Pk has mass Mk, and its orbit is circular with radius Rk. Its rotation period is 2Ï / Bk. Also, at t = 0, all the planets are aligned on the X-axis. Let M = M1 + … + Mn. Then the orbit of the centroid has the same formula as above, with Ak = Rk Mk / M for k = 1, …, n.
In the figures below, the left part represents the orbit of the centroid between t = 0 and t = 1,000 while the right part represents the orbit between t = 0 and t = 10,000.
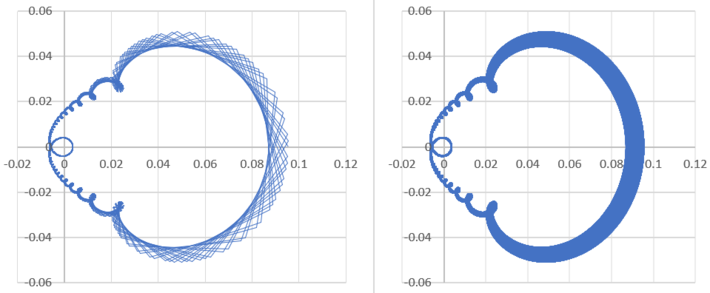
Figure 1
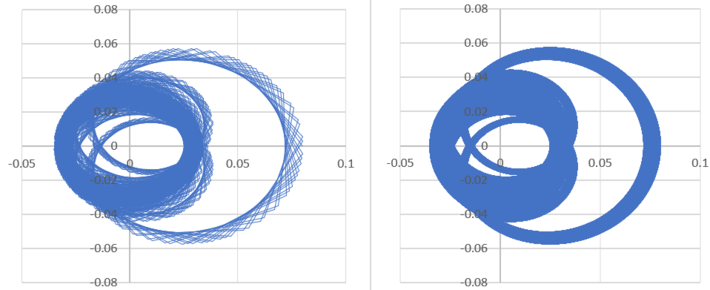
Figure 2
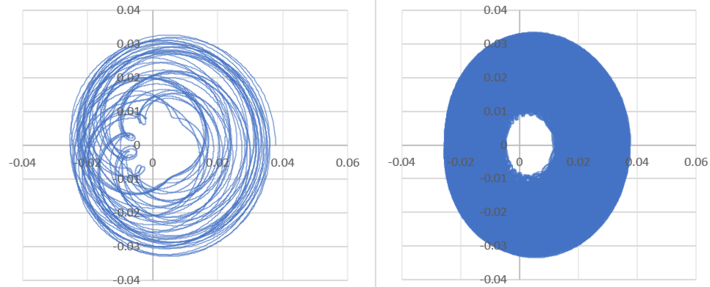
Figure 3
In figure 1, we have n = 100 planets, all the planets have the same mass, Bk = k + 1, and Rk = 1 / (k + 1)^0.7 [ that is, 1 / (k + 1) at power 0.7]. The orbit is periodic because the Bk‘s are integers, though the period involves numerous little loops due to the large number of planets. The periodicity is masked by the thickness of the blue curve, but would be obvious to the naked eye on the right part of figure 1, if we only had 10 planets. I chose 100 planets because it creates a more beautiful, original plot.
Figure 2 is the same as figure 1, except that planet P50 has a mass 100 times bigger than all other planets. You would think that the orbit of the centroid should be close to the orbit of the dominant planet, and thus close to a circle. However this is not the case, and you need a much bigger “outlier planet” to get an orbit (for the centroid) close to a circle.
In figure 3, n = 50, Mk = 1 / SQRT(k+1), Ak = 1.75^(k+1), and Bk = log(k+1). This time, the orbit is non periodic. The area in blue on the right side becomes truly dense when t becomes infinite; it is not a visual effect. Note that in all our examples, there is a hole encompassing the origin. In many other examples (not shown here), there is no hole. Figure 3 is related to our discussion in section 2.
None of the above examples is realistic, as they violate both Kepler’s third law (see here) specifying the periods of the planets given Rk (thus determining Bk), and Titius-Bode law (see here) specifying the distances Rk between the star and its k-th planet. In other words, it applies either to a universe governed by laws other than gravity, or in the early process of planet formation when individual planet orbits are not yet in equilibrium. It would be an easy exercise to input the correct values of Ak and Bk corresponding to the solar system, and see the resulting non periodic orbit for the centroid of the planets.
2. The Riemann Hypothesis
The Riemann hypothesis is one of the most famous unsolved mathematical conjectures. It states that the Riemann Zeta function has no zero in a certain area of the (complex) plane, or in other words, that there is a hole around the origin in its orbit, depending on the parameter s, just like in Figures 1, 2 and 3. Its orbit corresponds to Ak = 1 / k^s, Bk = log k, and n infinite. Unfortunately, the cosine and sine series X(t), Y(t) diverge if s is equal to or less than 1. So in practice, instead of working with the Riemann Zeta function, one works with its sister called the Dirichlet Eta function, replacing X(t) and Y(t) by their alternating version, that is Ak = (-1)^(k+1) / k^s. Then we have convergence in the critical strip 0.5 < s < 1. Proving that there is a hole around the origin if 0.5 < s < 1 amounts to proving the Riemann Hypothesis. The non periodic orbit in question can be seen in this article as well as in figure 4.
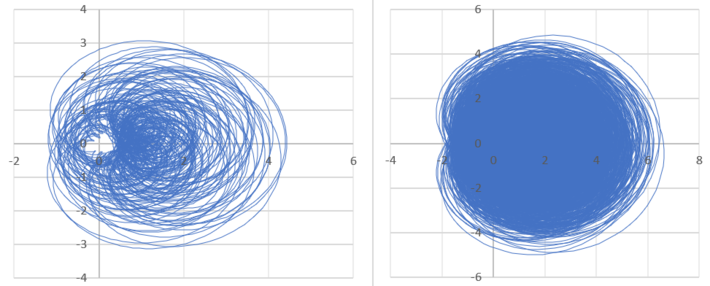
Figure 4
Figure 4 shows the orbit, when n = 1,000. The right part seems to indicate that the orbit eventually fills the hole surrounding the origin, as t becomes large. However this is caused by using only n = 1,000 terms in the cosine and sine series. These series converge very slowly and in a chaotic way. Interestingly, if n = 4, there is a well defined hole, see figure 5. For larger values of n, the hole disappears, but it starts reappearing as n becomes very large, as shown in the left part of figure 4.
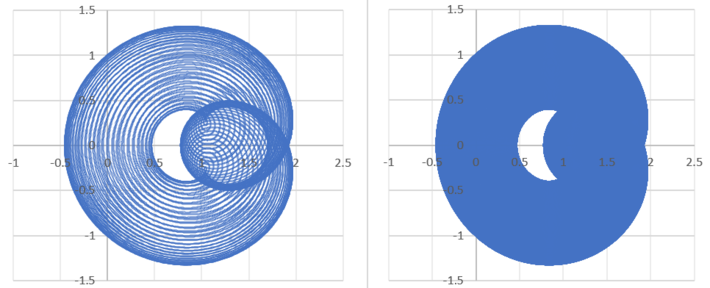
Figure 5
If n = 4 (corresponding to three planets in section 1 since the first term is constant here), a well defined hole appears, although it does not encompass the origin (see figure 5). Proving the existence of a non-vanishing hole encompassing the origin, regardless of how large t goes and regardless of s in ]0.5, 1[, when n is infinite, would prove the Riemann hypothesis.
Note the resemblance between the left parts of figure 3 and 4. This could suggest two possible paths to proving the Riemann Hypothesis:
- Approximating the orbit of figure 4 by a an orbit like that of figure 3, and obtain a bound on the approximation error. If the bound is small enough, it will result in a smaller hole in figure 4, but possibly still large enough to encompass the origin.
- Find a topological mapping between the orbits of figure 3 and 4: one that preserves the existence of the hole, and preserves the fact that the hole encompasses the origin.
3. Exercises
Here are a few questions for further exploration. They are related to section 1.
- In section 1, all the planets are aligned when t = 0. Can this still happen again in the future if n = 3? What if n = 4? Assume that the orbit of the centroid is non periodic, and n is the number of planets.
- What are the conditions necessary and sufficient to make the orbit of the centroid non periodic?
- At the initial condition (t = 0), is the centroid always inside the limit domain of oscillations (the right part on each figure, colored in blue)? Or can the orbit permanently drift away from its location at t = 0, depending on the Ak‘s and Bk‘s?
- Find an orbit that has no hole.
- Make a video, showing the planets moving around the star, as well as the orbital movement of the centroid of the planets. Make it interactive (like an API), allowing the users to input some parameters.
- Can you compute the shape of the hole is n = 3, and prove its existence?
- Try to categorize all possible orbits when n = 3 or n = 4.
To receive a weekly digest of our new articles, subscribe to our newsletter, here.
About the author: Vincent Granville is a data science pioneer, mathematician, book author (Wiley), patent owner, former post-doc at Cambridge University, former VC-funded executive, with 20+ years of corporate experience including CNET, NBC, Visa, Wells Fargo, Microsoft, eBay. Vincent is also self-publisher at DataShaping.com, and founded and co-founded a few start-ups, including one with a successful exit (Data Science Central acquired by Tech Target). He recently opened Paris Restaurant, in Anacortes. You can access Vincent’s articles and books, here.
