Offline marketing is far from dead
The marketing communication industry has three main players: the brand, the agency and the media owner. The agency, who is typically the middle-man, has the most visibility in attribution and drives majority of the tactical decisions of the brand. Having said that, the agency does not have an economic interest to maintain transparency between the brand and the media owner. This is particularly a problem when it comes to offline marketing, like TV or billboards, where data is very difficult to collect even for the agency.
We believe that the wide availability of data will bring more transparency to the industry and secure the future of offline media. This will cause a significant change in how the players operate and the credibility of the industry.
The decline of offline marketing
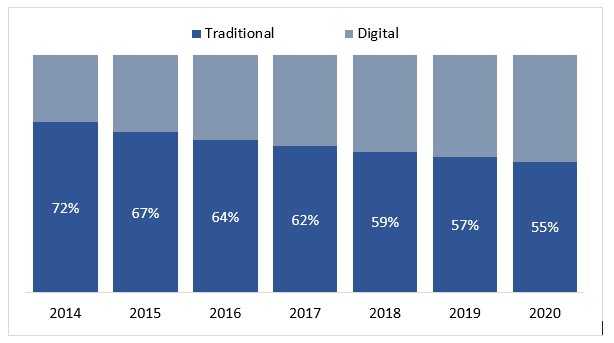
There has been a war raging between offline or traditional marketing and digital marketing since 2000 when Google launched AdWords. The traditional media spend has been decreasing steadily, hitting 60% in 2018. It is expected to continue declining.
While the perceived reason for this decline has been that digital marketing is better at reaching the target audience, however the deeper reason for this shift has been lack of data to prove the value of traditional media. When a brand manager spends USD 1M on a TV campaign versus Google AdWords: the amount of data available in Google AdWords is significantly more than the amount of data available from TV campaigns. It is this ability for brand managers to prove value to their superiors, that has led to decline of traditional media.

Media market share between traditional media and digital media
We firmly believe that traditional media scores better in some areas compared to digital media and our research focuses on procuring the data, insights and finally enabling brand managers to make decisions on traditional or offline media spending.
The scope of the problem is significant since majority of the companies spend 5% to 8% of their annual revenues on both offline and digital media. This translates to over USD 5 M a month in a company with USD 1 B in revenues. Depending on the country, the offline spend ranges from 40% to 70. This is over USD 3M per month spent on offline media in a USD 1 B dollar company. All this spending is done in the dark with very limited data.
Measuring return on investment of offline media spend is quite a challenge. We built attribution models for three offline media types — TV, OOH and POSM. An attribution model measures the return for each dollar spent on marketing. Digital marketing provides detailed attribution models. For example, Google Analytics provides this with a very high level of granularity. However, due to lack of data, attribution models are not straightforward in offline media.
Television (TV)
Brand managers have very limited information when deciding on the TV campaign modalities. Typically, they use Nielsen’s Gross Rating Points (GRP’s) or Target Rating Points (TRP’s) given to each TV programme telecasted. Rating points are a survey-based result for major programmes. In a country like India, with 200 M households with TV, the survey sample size is approximately 60,000. This represents 0.03% of sampling which is an insufficient sample size in the digital world. The results are also not granular enough to analyse, either by weekday or weekend, by city, and by time of the day. Utilizing data from vendors like Zapr, an Indian company, can help solve the problem. Zapr tracks the viewership behaviour by embedding SDK’s into partner apps and is collecting about 200 M data points per month in India in compliance with privacy and confidentiality regulations.

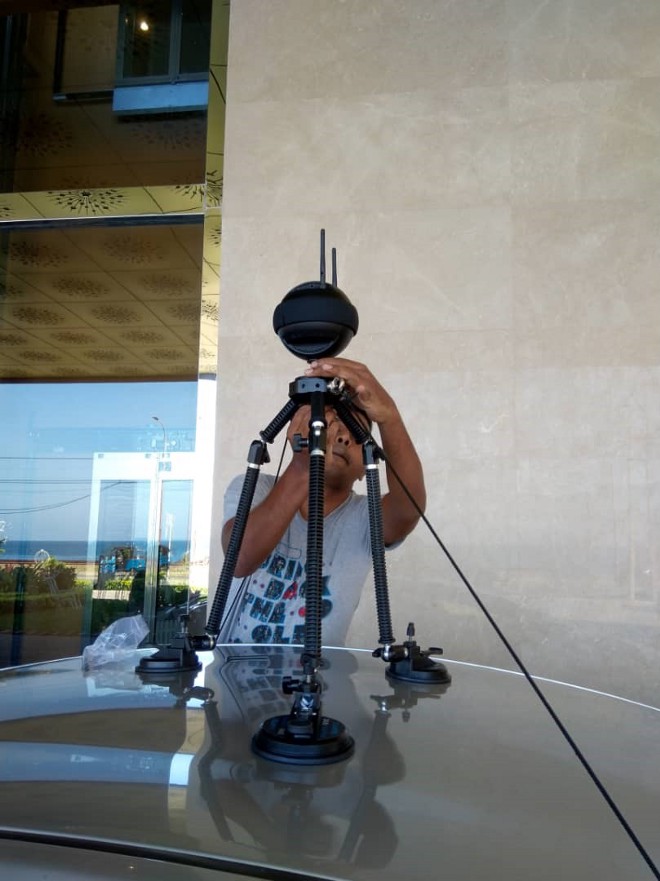
Setting up the 360-degree camera on the car
Out-of-Home (OOH)
The OOH industry is heavily fragmented and there is no universally accepted data. The billboard vendors provide traffic projections for the billboard assets that they own and there is no way to verify the data that these vendors provide. Hence, it is very difficult to compare assets across vendors and locations. Mobility analytics models can be developed using telecom data, GPS data from various sources along Google maps data. Using this model, we can measure the traffic with less than 10% error margin. We are also measuring the billboard size, height, and orientation to the road using TensorFlow image processing technique. Google StreetView data is accurate, but it is expensive and in many cities, it is seldom refreshed, particularly in emerging markets. Instead, we have captured the images for billboard by using 360-degree camera mounted on top of the car. Finally, we can compare the billboards across vendors and their location to be better able to distribute their marketing budget and make informed decisions.
Point-of-Sales Marketing (POSM)
We are using the images captured with the 360-degree camera to look your own logo along with their competitor’s logo. By doing this, we overlay the ‘ground presence’ of the company we are trying to measure along with its direct competitors. This provides the ability for them to target specific areas to gain market share.
Advantages of using data for offline marketing
Most companies use survey or sampling-based insights to drive decisions. However, using big data as described above has the following key differentiators.
- Reliable and consistent data: Telecom data is more consistent (a minimum of 24 datapoints per day per subscriber) and reliable (the number of tracking points is consistent) compared to solutions based on GPS data.
- Exclusive data: Building an exclusive 360-degree image database is exclusive just requires buying a 360 camera and putting it on a car. In a few days, we had one image every two meters for about 2,000 kms in four cities. The nearest competitor to this database is Google StreetView data which is often delayed by a minimum of one year.
- Action-oriented: Offline marketers need solutions which are decision and action-oriented while majority of the solutions available in the market only provide insights. Data-driven tools can be used by brand managers in their decisions — the TV dashboard provides preferred programmes, popular weekdays to air programmes, time of day and specifics to avoid.
- More power to brands: Majority of the tools in the industry are developed by agencies, which are self-serving for the advantage of the agency. In comparison, the above methodologies are targeted to help brands make informed decisions.
- ROI: Big data methodologies as described above allow measuring the cost per impression. Just by avoiding TV channels or billboard locations with bad ROI, and prioritizing those with good ROI, advertisers can increase offline marketing ROI by 3.
- Digital retargeting: brands could retarget the customers who have watched a TV advertisement with digital marketing ads to enable higher conversion rates, in compliance with privacy and confidentiality regulations. The same applies to customers who have viewed billboards based on the mobility analytics models.
Disclaimer
Opinions in the article do not represent the ones endorsed by the authors’ employer.
Authors
Pedro URIA RECIO
Ravi KUMAR MADAVARAM
