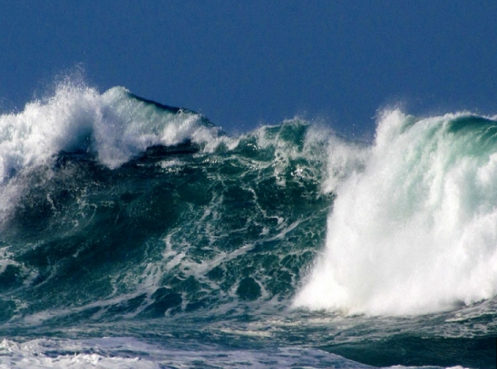
Using AI and data science, an MIT team was able to accurately predict rogue waves coming out of the blue in the middle of the ocean, in near real time, to help sailors change their navigation path and avoid destruction and death. Rogue waves, while rare, are unpredictable, tall (up to 100 feet) and devastating. The physical mechanism producing these waves is well understood, and is typically modeled using rotating elements.
Out of curiosity, I produced a video a few years ago, with rotating elements – this was a pure mathematical simulation just for fun – and it turns out that it models pretty well the mechanism that turns regular waves into rogue waves. The intent was to have some mathematical fun: indeed I called my video “belly dancing mathematics” as it also models that process quite well. I was not thinking about rogue waves at that time.
Interestingly, if you look at my video, made of 400 rotating points moving in time across hundreds of video frames, it really looks like a calm ocean suddenly turning into waves going berserk. This was a purely accidental discovery, as my point was not to try to understand rogue waves, but to play with simulations, not expecting what would pop out.
Click here to watch my video, get the data, and get the source code to generate rogue waves, and to understand the underlying – yet simple – mechanism creating these waves. This will also help you create your own rogue wave predictor, using predictive modeling and ad-hoc metrics associated with these waves. There is about 15 lines of easy code, so it’s pretty simple. Intriguingly, at least in the video, simulated rogue waves come in pairs, with unusually calm waters in the short time period between the two twin rogue waves. The twin rogue waves look like the first event and the aftershock in an Earthquake (which is another mechanism driven by waves). I still don’t know what makes the waves (big or small) move from the North West to the South East, in the video. Obviously, they have to move in some direction, but it still surprises me. Watch the video below:
The MIT article about rogue wave prediction can be found here. Artificial intelligence is used for computer vision to check various waves and their parameters, from a boat. Data science is used for predictive modeling, checking when (based on simulations as in my video), the wave patterns point to an incoming rogue wave, based on measured wave parameters evolving in real time, and matched back to the theoretical framework used in the simulations.
In my simulations, three parameters are driving the whole wave system, from quiet to rogue and conversely, over a 60-second time period:
- The radius of the underlying circles involved in these rotations (kept constant in my simulations)
- The distance between the centers of the circles (the locations of the 400 centers were kept constant)
- The speed at which each point rotates (they rotates at different but predictable speed, based on center location and time)
I am not sure if the same principles can be used to predict some types of rogue turbulence in the air (in clear sky), using devices attached to an aircraft, to help pilots and flyers avoid the most scary bumps.
Finally, this is an example where AI = IoT + DS, that is, Artificial Intelligence = Internet of Things (sensors on a boat to capture wave parameters) + Data Science (to analyze this sensor data, automatically, in real time, and predict when and where, and how big, the next rogue wave is going to be, and automatically pilot the boat).
About the author: Vincent Granville worked for Visa, eBay, Microsoft, Wells Fargo, NBC, a few startups and various organizations, to optimize business problems, boost ROI or to develop ROI attribution models, developing new techniques and systems to leverage modern big data and deliver added value. Vincent owns several patents, published in top scientific journals, raised VC funding, and founded a few startups. Vincent also manages his own self-funded research lab, focusing on simplifying, unifying, modernizing, automating, scaling, and dramatically optimizing statistical techniques. Vincent’s focus is on producing robust, automatable tools, API’s and algorithms that can be used and understood by the layman, and at the same time adapted to modern big, fast-flowing, unstructured data. Vincent is a post-doctorate from Cambridge University.
DSC Resources
- Career: Training | Books | Cheat Sheet | Apprenticeship | Certification | Salary Surveys | Jobs
- Knowledge: Research | Competitions | Webinars | Our Book | Members Only | Search DSC
- Buzz: Business News | Announcements | Events | RSS Feeds
- Misc: Top Links | Code Snippets | External Resources | Best Blogs | Subscribe | For Bloggers
Additional Reading
- What statisticians think about data scientists
- Data Science Compared to 16 Analytic Disciplines
- 10 types of data scientists
- 91 job interview questions for data scientists
- 50 Questions to Test True Data Science Knowledge
- 24 Uses of Statistical Modeling
- 21 data science systems used by Amazon to operate its business
- Top 20 Big Data Experts to Follow (Includes Scoring Algorithm)
- 5 Data Science Leaders Share their Predictions for 2016 and Beyond
- 50 Articles about Hadoop and Related Topics
- 10 Modern Statistical Concepts Discovered by Data Scientists
- Top data science keywords on DSC
- 4 easy steps to becoming a data scientist
- 22 tips for better data science
- How to detect spurious correlations, and how to find the real ones
- 17 short tutorials all data scientists should read (and practice)
- High versus low-level data science
Follow us on Twitter: @DataScienceCtrl | @AnalyticBridge

