- Thousands of people are injured by turbulence every year.
- New machine learning model gives high-accuracy, 10 second warning for turbulence.
- The model may lessen in-flight injuries and save lives.
Turbulence is one of the leading cause of injuries on passenger planes and—if you don’t have your seat belt on—those injuries can be fatal. Approximately 58 people are injured by turbulence every year in the U.S. while not wearing their seat belts [1]. While fatalities for commercial flights are rare, when you factor in general aviation—which includes aerial flight training, medevac operations, and recreational flying—turbulence encounters cause about 40 fatalities per year.
There is also a staggering financial cost linked to turbulence, with estimated costs to the airline industry of around $150-$500 million per year in accident investigations, aircraft damage, insurance claims, legal settlements, and missed work [2]. Some passengers are so traumatized by their experience, they swear to never fly again [3].
The Problem of Turbulence Detection
One of the main problems with detecting turbulence is its unpredictable nature, stemming from random motion between air layers moving at different speeds. Just as an ocean riptide creates a fast-moving channel of water that pulls you from shore, moving layers of air brushing against each other can fragment into disturbances that pull the aircraft in an unexpected direction [4]. Another issue is that turbulence isn’t caused by a single, semi-predictable weather event; the myriad of causes include uneven heating of earth’s surface, airflow disruptions by mountains, and jet streams. While one aircraft might pass safely through a particular disturbance, another flying through the same system minutes later might experience an event.
Current methods for detecting turbulence rely on data from Doppler radar, which provides data sets that are sometimes inaccurate or sparse. A recent study, presented in recently published conference paper from researchers at the Aerospace Systems Design Laboratory at the Georgia Institute of Technology [5], suggests that combining this sparse data with the “wealth of data” collected in-flight can improve the Eddy Dissipation Rate —a universally used, reliable measure of turbulence. Although many studies have addressed this issue before, the GIT researchers took a new turn by creating a prediction model based on supervised learning. This new approach can estimate turbulence severity at a future point in time.
The Prediction Model

The research methodology followed a typical machine learning pipeline with one major difference: the flight data was processed to give sliding window features for the model, enabling the prediction of future turbulence. The steps, detailed in the above image, were:
- Data collection: Flight data was collected from commercial airlines. This consisted of time-series measurements with hundreds of parameters such as Boolean, continuous and discrete data, and text. The parameters were divided into categories and levels based on what part of the aircraft the data came from. For example, atmospheric data from devices like barometers, pitot tubes and thermometers provided data on altitude, speed, and temperature. Flight data from two minutes before and after a turbulence event was isolated.
- Preprocessing: This step removed corrupted, highly correlated, and empty columns—an essential step for training the model.
- Breakdown into windows: After the data was broken into lengths of n seconds, the lengths were combined to create a single long feature vector.
- Regression and Classification: EDR values for regression and class labels (actual turbulence level) for classification were built with the Gradient Boosting algorithm to give a true prediction value for the turbulence model. A relatively simply method was used, containing one equation with two parameters: true airspeed and vertical windspeed.
- Post-Processing: The trained and validated models were compared with actual data. The method was implemented on a real-world dataset from approximately 6,000 flights that experienced turbulence.
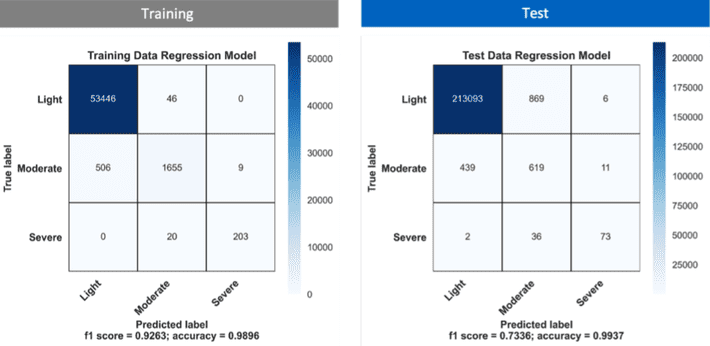
Rather than predict the exact EDR rate, the researchers used three labels depicting turbulence severity: light, moderate, and severe intensity levels. The most important parameter for turbulence prediction was vertical wind (which was expected by the team), followed by acceleration, vertical speed, and fuel flow. The model correctly predicted the turbulence severity levels, with extremes (low turbulence predicted as high or vice-versa) practically zero as the following confusion matrix shows:

The results showed that the models are effective in predicting turbulence severity 10 seconds prior to an event, giving pilots enough time to install safety procedures. Ten seconds warning may not give you time to return to your seat and buckle up, though, giving you one more reason to pay close attention to that seatbelt sign.
References
Top image: Adobe Creative Cloud [Licensed]
[2] MACHINE LEARNING ENABLED TURBULENCE PREDICTION USING FLIGHT DATA FO…
[3] Turbulence and Its Impact on Commercial Aviation
[4] Clearing the Air About Turbulence
[5] Predicting Turbulence Using Operational Numerical Prediction Models
