Source: www.mstecker.com/
Clustering is an unsupervised technique which classifies certain objects into groups called Clusters such that the objects within one cluster have similar pattern and have distinct pattern as compared to objects in other clusters.
Market Segmentation using clustering analysis helps in dividing various markets into small buckets based on the similarity or uniqueness in customer behavior and other aspects. Some of the characteristics include price point of different brands, market share of brands, demographics (age, gender, income), behavioral (usage, frequency, loyalty), geographical, propensity, media habits etc.
In this article, I will present a small case study on how k-means can be applied to cluster various markets and what insights can be generated from the results.
Let’s say in a nation there are 50 markets. We have the data for the following variables for each of these markets:
- Market Share of major brands
- Market Share — Your own brand
- Market Share growth — Your own brand
- Average Price (Major Brands)
We need to segment the markets based on the above features and find 5–6 clusters. Each cluster thus would have similar characteristic market. This would help in formulating marketing strategy for each cluster rather than focusing on all 20 markets individually.
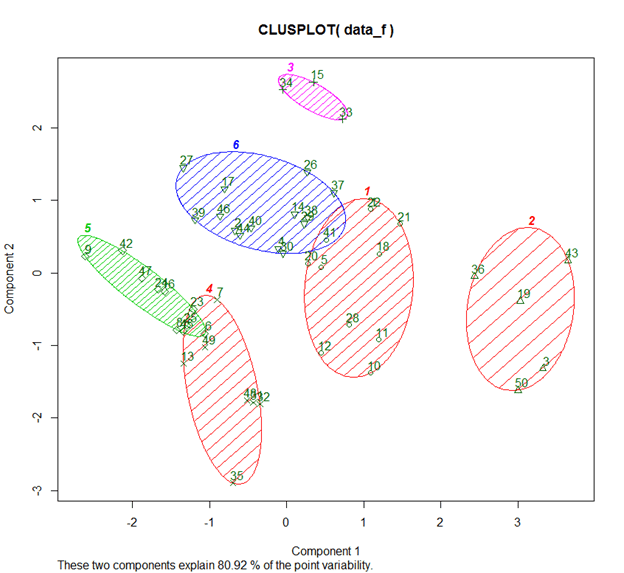
Using k-means algorithm, the markets are segmented into 6 clusters.
The following steps were undertaken to perform k-means:
I. Data cleaning and checking for missing values
II. Data normalization (all the variables have different units)
III. Running k-means algorithm with k = 5 or 6 (here k is n.o of clusters)
IV. Using elbow-method to find the right no. of clusters (you can use other methods like Average Silhouette and Gap statistics)
You must be wondering why I have picked up 5-6 clusters. This is where domain knowledge comes into picture. By taking 6 clusters, we are assuming that we can divide the markets in a nation into 6 clusters. The markets in each cluster would have similar characteristics. The assumption or hunch comes from domain knowledge.
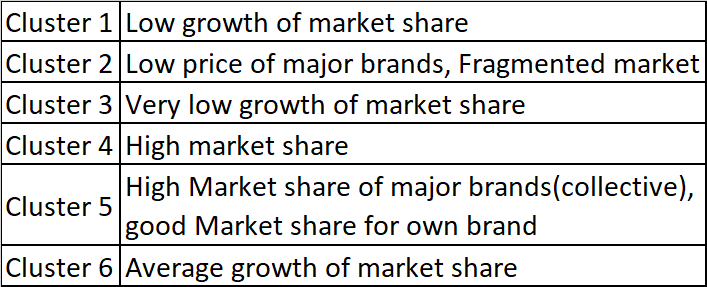
Based on the above method, the markets are divided into 6 clusters and the analysis reveals the following:
You might be wondering how these clusters were formed and what are component 1 and component 2. Under the hood, PCA is at play. We could also use t-SNE to represent clusters in higher dimensions.
So through PCA we get to know that the following two variables explain 80.9% variance in the model:
I. Market Share of major brands: 49.2%
II. Your own Brand Market Share : 31.7%
In dimensionality reduction techniques, we ignore Eigen vectors/components that don’t explain much variance, thus having reduced number of variables than actual.Here we won’t ignore or remove any variables, instead the goal is to see which variables were key in formation of the clusters.
So, what are the insights?
- To reiterate, we have 6 clusters.
- Each of these clusters, represent similar markets
- Market Share is the variable based on which uniqueness or similarity of markets can be inferred upon (remember the variance of 80.91 through PCA !!)
The link to Marketing Mix Modeling
Companies are usually interested in understanding Marketing Mix across multiple markets. But they might not perform such analysis due to
- Limited Budget
- Time Constraints
They have few markets which is on their radar due to Pareto principle: 80 % of revenue coming from 20% of markets.
So, Market Segmentation comes to their rescue. Instead of building 50 models, they can pick up high potential markets from each cluster and focus on getting the right Marketing Mix there.
There is a proverbial saying— “Don’t miss the forest for the trees!!!”
K means in a marketing context helps marketers “Not miss the forest for the trees”

Source: Max and Dee Bernt/flickr


