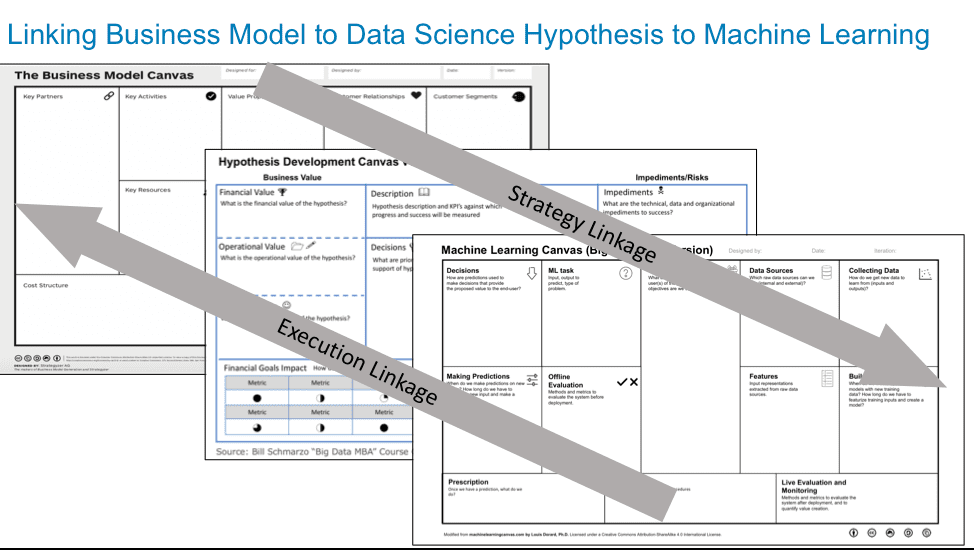
In the blog “Data Science ‘Paint by the Numbers’ with the Hypothesis Development…,” I introduced the Hypothesis Development Canvas as a tool for linking an organization’s data science activities with the organization’s strategic business initiatives (see Figure 1).
Figure 1: Using Hypothesis Development Canvas to link Machine Learning initiatives to Business Model
Since publishing that blog, I’ve had a chance to test the canvas with my University of San Francisco students. And I’ll also be testing the Hypothesis Development Canvas this week during my TDWI session “T6A Big Data MBA: Driving Digital Transformation with Big Data and …” in Orlando (a special surprise for my workshop attendees!!)
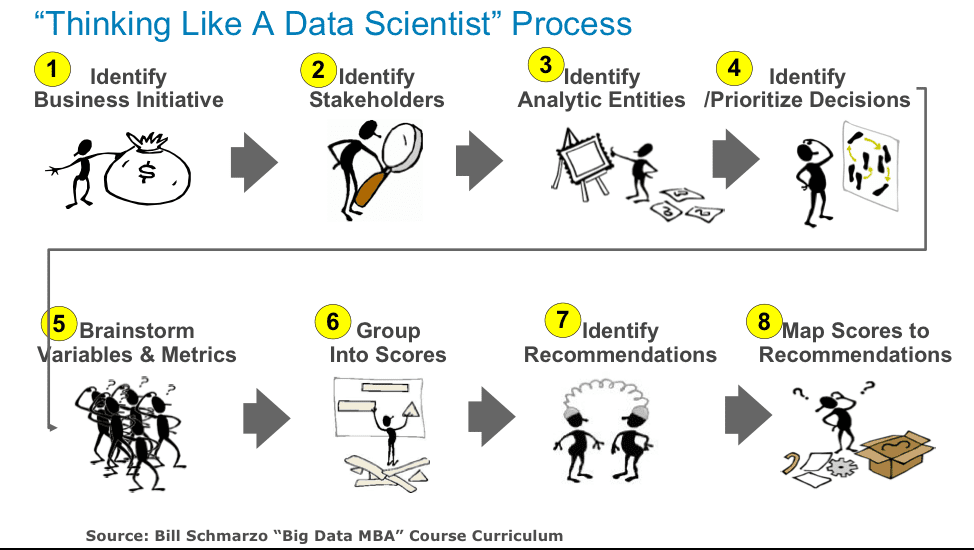
The Hypothesis Development Canvas has proven to be a big hit with my students. It is an effective and concise tool that integrates the different elements of the “Thinking Like A Data Scientist” process into a single document (see Figure 2).
Figure 2: “Thinking Like A Data Scientist” Process
The Hypothesis Development Canvas also ensures that data science work directly supports the organization’s business and operational strategies; that the organization’s precious data science and business leadership resources are focused on the organization’s most important business initiatives.
Disclaimer: This is a “Business” hypothesis development and not a “Statistical” hypothesis testing which is the formal procedures used by statisticians to accept or reject statistical hypotheses (i.e., null hypothesis, null hypothesis).
I am going to use this blog to provide more details and some instructions on the use of the Hypothesis Development Canvas. I will provide an example Hypothesis Development Canvas for our University of San Francisco Big Data MBA in-class Chipotle assignment.
Hypothesis Development Canvas v0.4
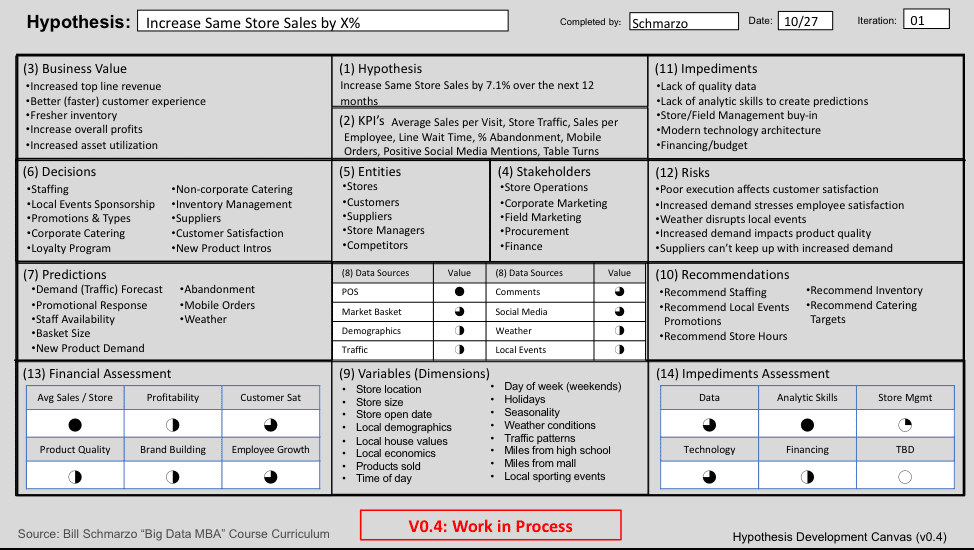
Below is the most current version of the Hypothesis Development Canvas – version 0.4 (see Figure 3).
Figure 3: Hypothesis Development Canvas v0.4
We added some panels, combined other panels, and added numbers to support the flow of the canvas creation process (thanks John Morley). Here are the Instructions for each of the numbered panels on the Hypothesis Development canvas in Figure 2:
- What is the hypothesis or use case that you are trying to improve, reduce or optimize (e.g., increase customer retention, reduce obsolete & excessive inventory, optimize marketing spend, reduce unplanned operational downtime)?
- What are key performance indicators (KPI’s) or metrics against which hypothesis progress and success will be measured?
- What is the business value of the hypothesis from the financial, operational and customer perspectives; that is, what are the benefits of the successful execution of the hypothesis on the finances of the business (e.g., increase sales, reduce costs, optimize spend), the operations of the business (e.g., improve operational effectiveness, reduce unnecessary inventory, reduce overtime, reduce logistics, provisioning and inventory costs), and/or upon customers (Customer Satisfaction, Likelihood to Recommend, Net Promoter Scores)?
- Who are the business stakeholders, business functions or constituents who either impact or are impacted by the Hypothesis?
- What are entities – human or device/machine – around which to build the analytics (e.g., customers, patients, students, turbines, chillers, compressors)?
- What are most important business and operational decisions that need to be made in support of hypothesis?
- What are the predictions that might be required to support the business or operational decisions (e.g., predict at-risk customers, successful campaigns, potentially failing parts, component wear-and-tear)?
- What data sources might be necessary to support the predictions; that is, “What predictions are you trying to make, andwhat data might be useful in making that prediction?”
- What are the variables and metrics that might yield better predictors of performance? Use the “By Analysis” technique to help brainstorm those variables and metrics – “I want to make performance predictions “by” store, store remodel date, most popular products, local demographics, customer segment, etc.?
- What business and operational recommendations are required to support the decisions; that is; what should I do, where should I do it, who should do it, when should they do it, what will they need to do it, etc.?
- What are the potential technical, data and/or organizational impediments to success (e.g., data availability, data quality, technical skills, architecture, management support)?
- What are costs or risks associated with the predictive model being wrong; that is, what are the financial, operational and customer costs associated with the model yielding False Positives (predicts a condition to exist when it does not) and False Negatives (does not predict a condition when it does exist)?
Chipotle Hypothesis Development Canvas
Figure 4 shows a completed Hypothesis Development Canvas for the Chipotle “Increase sales store sales” business initiative.
Figure 4: Chipotle Exercise Hypothesis Development Canvas
Again, see the blog “Refined Thinking like a Data Scientist Series” for the content for the Hypothesis Development Canvas example (and heck, give yourself the assignment to complete the Hypothesis Development Canvas for Chipotle).
Summary
We’ll continue to test and make refinements to the Hypothesis Development Canvas. I also encourage others to test, stretch, bend and abuse the canvas as a way to ensure that it reflects the best thinking of all parties. Thanks for your help!


