by Robert Robison, Data Analyst, Elder Research

In 2019, over 40 million Americans wagered money on March Madness brackets, according to the American Gaming Association. Most of this money was bet in “bracket pools,” which consist of a group of people each entering their predictions of the NCAA tournament games along with a buy-in. The bracket that comes closest to being right wins. If you also consider the bracket pools where only pride is at stake, the number of participants is much greater. Despite all this attention, most do not give themselves the best chance to win because they are focused on the wrong question.
The Right Question
Mistake #3 in Dr. John Elder’s Top 10 Data Science Mistakes is to ask the wrong question. A cornerstone of any successful analytics project starts with having the right project goal; that is, to aim at the right target. If you’re like most people, when you fill out your bracket, you ask yourself, “What do I think is most likely to happen?” This is the wrong question to ask if you are competing in a pool because the objective is to win money, NOT to make the most correct bracket. The correct question to ask is: “What bracket gives me the best chance to win $?” 1 While these questions seem similar, the brackets they produce will be significantly different.
If you ignore your opponents and pick the teams with the best chance to win games — you will reduce your chance of winning money. Even the strongest team is unlikely to win it all, and even if they do, plenty of your opponents likely picked them as well. The best way to optimize your chances of making money is to choose a champion team with a good chance to win who is unpopular with your opponents.
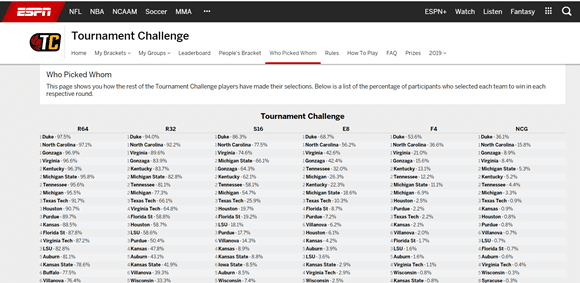
Knowing how other people in your pool are filling out their brackets is crucial, because it helps you identify teams that are less likely to be picked. One way to see how others are filling out their brackets is via ESPN’s Who Picked Whom page (Figure 1). It summarizes how often each team is picked to advance in each round across all ESPN brackets and is a great first step towards identifying overlooked teams.

Figure 1. ESPN’s Who Picked Whom Tournament Challenge page
For a team to be overlooked, their perceived chance to win must be lower than their actual chance to win. The Who Picked Whom page provides an estimate of perceived chance to win, but to find undervalued teams we also need estimates for actual chance to win. This can range from a complex prediction model to your own gut feeling. Two sources I trust are 538’s March Madness predictions and Vegas future betting odds. 538’s predictions are based on a combination of computer rankings and has predicted performance well in past tournaments. There is also reason to pay attention to Vegas odds, because if they were too far off, the sportsbooks would lose money.
However, both sources have their flaws. 538 is based on computer ratings, so while they avoid human bias, they miss out on expert intuition. Most Vegas sportsbooks likely use both computer ratings and expert intuition to create their betting odds, but they are strongly motivated to have equal betting on all sides, so they are significantly affected by human perception. For example, if everyone was betting on Duke to win the NCAA tournament, they would increase Duke’s betting odds so that more people would bet on other teams to avoid large losses. When calculating win probabilities for this article, I chose to average 538 and Vegas predictions to obtain a balance I was comfortable with.
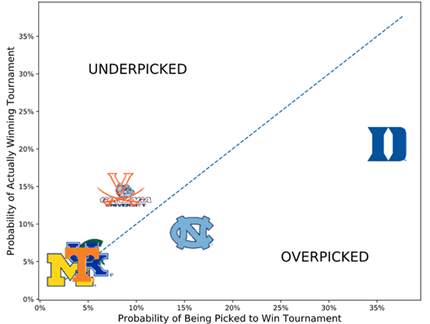
Let’s look at last year. Figure 2 compares a team’s perceived chance to win (based on ESPN’s Who Picked Whom) to their actual chance to win (based on 538-Vegas averaged predictions) for the leading 2019 NCAA Tournament teams. (Probabilities for all 64 teams in the tournament appear in Table 6 in the Appendix.)

Figure 2. Actual versus perceived chance to win March Madness for 8 top teams
As shown in Figure 2, participants over-picked Duke and North Carolina as champions and under-picked Gonzaga and Virginia. Many factors contributed to these selections; for example, most predictive models, avid sports fans, and bettors agreed that Duke was the best team last year. If you were the picking the bracket that was most likely to occur, then selecting Duke as champion was the natural pick. But ignoring selections made by others in your pool won’t help you win your pool.
While this graph is interesting, how can we turn it into concrete takeaways? Gonzaga and Virginia look like good picks, but what about the rest of the teams hidden in that bottom left corner? Does it ever make sense to pick teams like Texas Tech, who had a 2.6% chance to win it all, and only 0.9% of brackets picking them? How much does picking an overvalued favorite like Duke hurt your chances of winning your pool?
To answer these questions, I simulated many bracket pools and found that the teams in Gonzaga’s and Virginia’s spots are usually the best picks—the most undervalued of the top four to five favorites. However, as the size of your bracket pool increases, overlooked lower seeds like third-seeded Texas Tech or fourth-seeded Virginia Tech become more attractive. The logic for this is simple: the chance that one of these teams wins it all is small, but if they do, then you probably win your pool regardless of the number of participants, because it’s likely no one else picked them.
Simulations Methodology
To simulate bracket pools, I first had to simulate brackets. I used an average of the Vegas and 538 predictions to run many simulations of the actual events of March Madness. As discussed above, this method isn’t perfect but it’s a good approximation. Next, I used the Who Picked Whom page to simulate many human-created brackets. For each human bracket, I calculated the chance it would win a pool of size n by first finding its percentile ranking among all human brackets assuming one of the 538-Vegas simulated brackets were the real events. This percentile is basically the chance it is better than a random bracket. I raised the percentile to the n-1 power, and then repeated for all simulated 538-Vegas brackets, averaging the results to get a single win probability per bracket.
For example, let’s say for one 538-Vegas simulation, my bracket is in the 90th percentile of all human brackets, and there are nine other people in my pool. The chance I win the pool would be 0.9^9=0.387. If we assumed a different simulation, then my bracket might only be in the 20th percentile, which would make my win probability 0.2^9≈0.0. By averaging these probabilities for all 538-Vegas simulations we can calculate an estimate of a bracket’s win probability in a pool of size n, assuming we trust our input sources.
Results
I used this methodology to simulate bracket pools with 10, 20, 50, 100, and 1000 participants. The detailed results of the simulations are shown in Tables 1-6 in the Appendix. Virginia and Gonzaga were the best champion picks when the pool had 50 or fewer participants. Yet, interestingly, Texas Tech and Purdue (3-seeds) and Virginia Tech (4-seed) were as good or better champion picks when the pool had 100 or more participants.
Takeaways from the simulations:
- Regardless of bracket pool size, the champion pick is most important in determining the chance of winning a bracket pool. Picks before the Final Four have limited importance.
- In most pools, picking the most undervalued of the top four or five favorites to be the champion gives you the best chance to win.
- In larger bracket pools, picking lower-seeded undervalued teams gives you the best chance to win. Even in very large pools, there is a good chance that such teams (here, like Virginia Tech) will not be picked as champions by anyone. Even though their actual chance to win it all is small, if they do, you will likely win your pool regardless of the number of participants.
Additional Thoughts
We have assumed that your local pool makes their selections just like the rest of America, which probably isn’t true. If you live close to a team that’s in the tournament, then that team will likely be over-picked. For example, I live in Charlottesville (home of the University of Virginia), and Virginia has been picked as the champion in roughly 40% of brackets in my pools over the past couple of years. If you live close to a team with a high seed, one strategy is to start with ESPN’s Who Picked Whom odds, and then boost the odds of the popular local team and correspondingly drop the odds for all other teams. Another strategy I’ve used is to ask people in my pool who they are picking. It is mutually beneficial, since I’d be less likely to pick whoever they are picking.
As a parting thought, I want to describe a scenario from the 2019 NCAA tournament some of you may be familiar with. Auburn, a five seed, was winning by two points in the waning moments of the game, when they inexplicably fouled the other team in the act of shooting a three-point shot with one second to go. The opposing player, a 78% free throw shooter, stepped to the line and missed two out of three shots, allowing Auburn to advance. This isn’t an alternate reality; this is how Auburn won their first-round game against 12-seeded New Mexico State. They proceeded to beat powerhouses Kansas, North Carolina, and Kentucky on their way to the Final Four, where they faced the exact same situation against Virginia. Virginia’s Kyle Guy made all his three free throws, and Virginia went on to win the championship.
I add this to highlight an important qualifier of this analysis—it’s impossible to accurately predict March Madness. Were the people who picked Auburn to go to the Final Four geniuses? Of course not. Had Terrell Brown of New Mexico State made his free throws, they would have looked silly. There is no perfect model that can predict the future, and those who do well in the pools are not basketball gurus, they are just lucky. Implementing the strategies talked about here won’t guarantee a victory; they just reduce the amount of luck you need to win. And even with the best models—you’ll still need a lot of luck. It is March Madness, after all.
Appendix: Detailed Analyses by Pool Size
At baseline (randomly), a bracket in a ten-person pool has a 10% chance to win. Table 1 shows how that chance changes based on the round selected for a given team to lose. For example, brackets that had Virginia losing in the Round of 64 won a ten-person pool 4.2% of the time, while brackets that picked them to win it all won 15.1% of the time. As a reminder, these simulations were done with only pre-tournament information—they had no data indicating that Virginia was the eventual champion, of course.
Table 1 – Probability that a bracket wins a ten-person bracket pool given that it had a given team (row) making it to a given round (column) and no further

In ten-person pools, the best performing brackets were those that picked Virginia or Gonzaga as the champion, winning 15% of the time. Notably, early round picks did not have a big influence on the chance of winning the pool, the exception being brackets that had a one or two seed losing in the first round. Brackets that had a three seed or lower as champion performed very poorly, but having lower seeds making the Final Four did not have a significant impact on chance of winning.
Table 2 shows the same information for bracket pools with 20 people. The baseline chance is now 5%, and again the best performing brackets are those that picked Virginia or Gonzaga to win. Similarly, picks in the first few rounds do not have much influence. Michigan State has now risen to the third best Champion pick, and interestingly Purdue is the third best runner-up pick.
Table 2 – Probability that a bracket wins a 20-person bracket pool given that it had a given team (row) making it to a given round (column) and no further

When the bracket pool size increases to 50, as shown in Table 3, picking the overvalued favorites (Duke and North Carolina) as champions significantly lowers your baseline chances (2%). The slightly undervalued two and three seeds now raise your baseline chances when selected as champions, but Virginia and Gonzaga remain the best picks.
Table 3 – Probability that a bracket wins a 50-person bracket pool given that it had a given team (row) making it to a given round (column) and no further

With the bracket pool size at 100 (Table 4), Virginia and Gonzaga are joined by undervalued three-seeds Texas Tech and Purdue. Picking any of these four raises your baseline chances from 1% to close to 2%. Picking Duke or North Carolina again hurts your chances.
Table 4 – Probability that a bracket wins a 100-person bracket pool given that it had a given team (row) making it to a given round (column) and no further

When the bracket pool grows to 1000 people (Table 5), there is a complete changing of the guard. Virginia Tech is now the optimal champion pick, raising your baseline chance of winning your pool from 0.1% to 0.4%, followed by the three-seeds and sixth-seeded Iowa State are the best champion picks.
Table 5 – Probability that a bracket wins a 1000-person bracket pool given that it had a given team (row) making it to a given round (column) and no further

For reference, Table 6 shows the actual chance to win versus the chance of being picked to win for all teams seeded seventh or better. These chances are derived from the ESPN Who Picked Whom page and the 538-Vegas predictions. The data for the top eight teams in Table 6 is plotted in Figure 2. Notably, Duke and North Carolina are overvalued, while the rest are all at least slightly undervalued.
The teams in bold in Table 6 are examples of teams that are good champion picks in larger pools. They all have a high ratio of actual chance to win to chance of being picked to win, but a low overall actual chance to win.
Table 6 – Actual odds to win Championship vs Chance Team is Picked to Win Championship. Undervalued teams in green; over-valued in red.

[1] This requires studying the payout formula. I used ESPN standard scoring (320 possible points per round) with all pool money given to the winner. (10 points are awarded for each correct win in the round of 64, 20 in the round of 32, and so forth, doubling until 320 are awarded for a correct championship call.)
Originally published on ElderResearch.com here.
