The distribution of data means the way the data gets spread out. This article talks about some essential concepts of the normal distribution:
- How to measure normality
- Ways to transform a dataset to fit the normal class distribution
- How to use the normal distribution to showcase naturally distributed phenomena and provide statistical insights
Lets get started!
Suppose you belong to the field of statistics. In that case, you know how vital data distribution is because we always sample from a population where you have no idea about full distribution. As a result, the distribution of our sample might limit the statistical techniques available to us.
Looking at the normal distribution, it is a frequently perceived continuous probability distribution.
When a database meets the normal distribution, you can employ other techniques to explore the data more.
- Knowledge about the percentage of data in each standard deviation
- Linear least-squares regression
- Inference based on the sample mean
In some cases, it can be beneficial to change a skewed dataset to observe the normal distribution. It will be more relevant when your data is usually distributed for some distortion.
Here are the basic features of the normal distribution:
- Symmetric bell shape
- Equal Mean and median at the center of the distribution
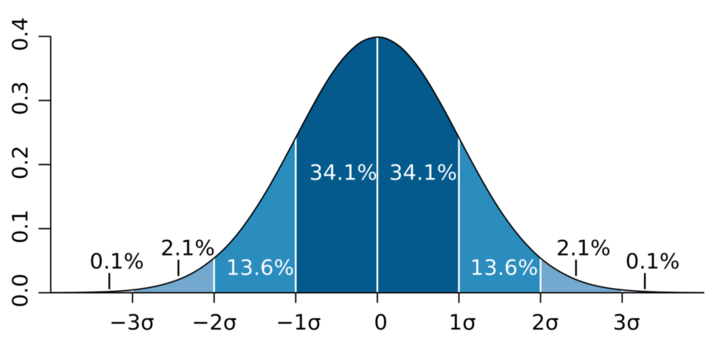
- 68% of the comedown within 1 standard deviation of the mean
- 95% of the data come down within 2 deviations of the mean
- 99.7% of the data falls between 3 standard deviations of the mean

M.W. Toews via Wikipedia
Important terms you need to know as a general overview of the normal distribution:
- Normal Distribution: It is a symmetric probability distribution frequently used to represent real-valued random variables. Also called the bell-curved or Gaussian distribution.
- Standard Deviation: It measures the amount of variation or dispersion of a set of values. It is also calculated as the square root of variance.
- Variance: It is the distance from the mean of each data point
Ways to Use Normal Distribution
If the dataset you have does not conform to the normal distribution, you could apply these tips.
- Collect more data: Even a tiny sample size lacking quality could distort your customarily distributed dataset. As a solution, collecting more data is the key.
- Reduce sources of variance: Reducing the outliers can help with the normal distribution of data.
- Apply a power transform: You can choose to apply the Box-Cox method for skewed data, which refers to taking the square root and the log of the observation.
Lets also overview some normality measures and how you would use them in a Data science project.
Skewness
It is a measure of asymmetry relative to the mean.

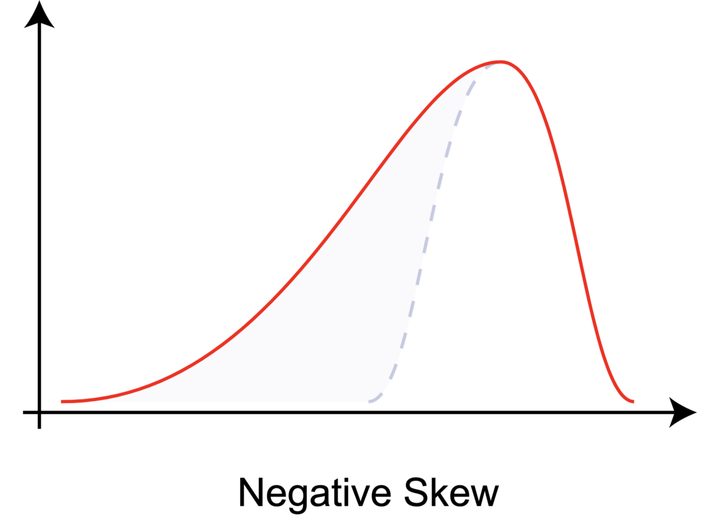
Source: Rodolfo Hermans via Wikipedia
The above graph has negative skewness. That means that the tail of the distribution is longer on the left side. The counterintuitive thing is that most of the data points are clustered on the right side. Make sure you are not getting confused with right or positive skewness that might get represented by this graphs mirror image.
A Brief on How to Use Skewness
It is a significant factor in model performance. You can use skew from the scipy stats module to measure skewness.

Source: SciPy
The skewness measure can drive us to the potential deviation in model performance across all the feature values. A positively skewed feature for example the second array in the above image can enable better performance on lower values.
Kurtosis
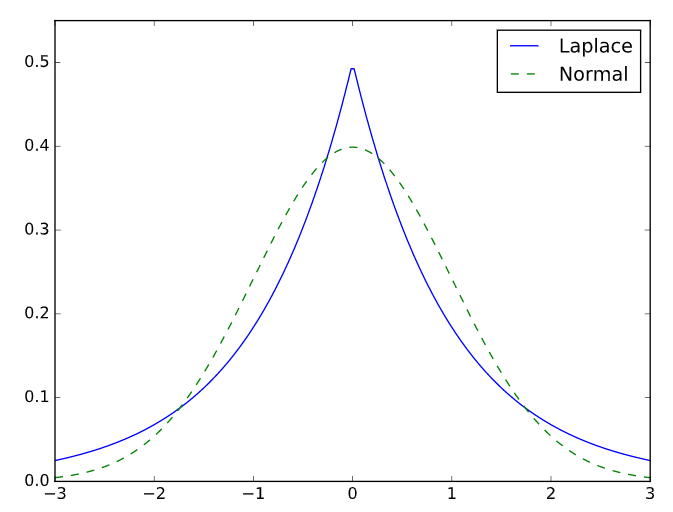
The original meaning of Kurtosis is a measure of the tailedness of the distribution. It is typically measured relative to 0, the kurtosis value of the normal distribution with Fishers definition. A positive kurtosis value identifies fatter tails.
The Laplace Distribution has kurtosis > 0. via John D. Cook Consulting.

A Guide to using Kurtosis
Understanding kurtosis supply a lens to the presence of outliers in a dataset. To measure kurtosis, you can use kurtosis from the scipy.stats module. Negative kurtosis indicates data that is grouped meticulously around the mean with fewer outliers.

Via SciPy
A Caution about the Normal Distribution
Various naturally occurring datasets conform to the normal distribution. This claim has been made for everything from IQ to human heights. While normal distribution is drawn from observations of nature and frequently occurs, which is true, we risk oversimplification by applying this assumption too liberally.
Often the standard model wont fit well in the extremes. It also undermines the probability of rare events.
Calculate the Share of Values within SD
As the amount of data set gets larger and larger, calculating the standard deviation (SD) and the number of values falling within each quarter of the bell-shaped curve becomes difficult. To this end, an empirical rule calculator can make the process faster. This calculator calculates the share of values that fall within a particular SD from the mean or the dataset average. To calculate the percentage of values, we just need to have mean and SD value handy.
Summary
This brief article covered everything about normal distributionsome fundamental concepts, how to measure them, and how to use them. Make sure not to over-apply normal distribution, or you risk discounting the chances of outliers. Let us know how it helped you in understanding the concepts.
