This is the most comprehensive guide to Ratio Analysis / Financial Statement Analysis
This expert-written guide goes beyond the usual gibberish and explore practical Financial Statement Analysis as used by investment bankers and equity research analysts.
Table of Content:
- What is Financial Statement Analysis / Ratio Analysis
- Vertical Analysis or Common Size Statements
- Horizontal Analysis
- Trend Analysis
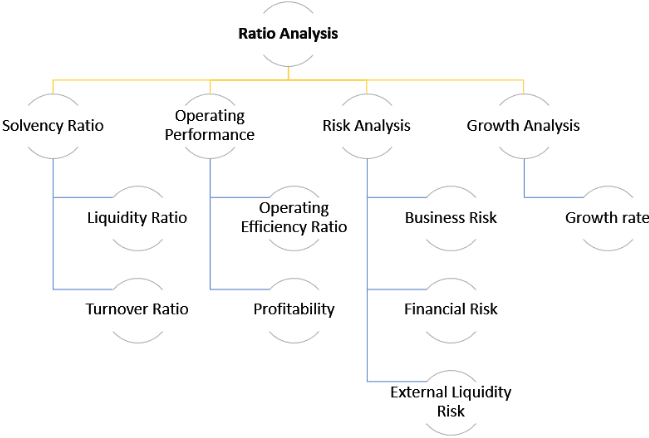
- Ratio Analysis
- Liquidity Ratios
- Solvency Ratios
- Turnover Ratios
- Ratio Analysis – Operating Performance
- Operating Efficiency Ratios
- Operating Profitability Ratios
- Ratio Analysis – Risk
- Business Risk
- Financial Risk
- Ratio Analysis – External Liquidity Risk
The purpose of Financial Statement Analysis is to evaluate management performance in Profitability, Efficiency and Risk
Although financial statement information is historical, it is used to project future performance
Financial Statement Analysis can be done using Three Methods –

- Vertical Analysis (also called as Common Size Statements Analysis) – It compares the each item of to the base case of the financial statements. All income statement items are expressed as percentage of Sales.
- Balance Sheet Items are expressed as a percentage of Total Assets or Total Liabilities (please note Total Assets = Total Liabilities)
- Horizontal Analysis – It compares the two financial statements (income statement, balance sheet) o determine the absolute change as well as percentage changes.
Ratio Analysis – Puts important business variables into perspective by comparing it with other numbers. It provides meaningful relationship between individual values in the financial statements.
So, which one is the best when it comes to Financial Statement Analysis?
Ofcourse, you can’t pick and choose a single method as the best and ONLY method to do the financial statement analysis.
You need to do all THREE analysis in-order to get a complete picture of the Company.
Let us look at each one of them one by one.
Read tutorial here.

