This article was written by Graph Commons.
A common task for a data scientist is to identify clusters in a given data set. The idea is to simply find groups of objects that have more connections or similarities to one another than they do to outsiders. In the study of networks, we use clustering to recognize communities within large groups of connections.
Typically, a force-directed layout algorithm organizes a network map, makes patterns visually comprehensible, but it cannot identify and mark the clusters. Furthermore, in large network maps, the high level of detail overwhelms our senses. To be able to precisely examine its patterns, we need quantitative views of the data contained in the network. While there are a variety of data clustering methods in machine learning, the Louvain Modularity algorithm works well particularly for large data-networks. It detects tightly knit groups characterized by a relatively high density of ties. Beyond the visual realm, you can use a Louvain clustering algorithm to partition a many million-node online social network onto different machines.
Once the network clusters are detected, the identified groups of nodes can be given distinct color and names, so they are clearly differentiated and together provide a summary of the larger network. We can label a cluster based on the commonalities of its nodes or the most central nodes found in the grouping.
In Graph Commons, you can use clustering on your data-networks using the Analysis bar. You first click on the “Run Clustering” button, then set the resolution of how much granular clusters the algorithm should identify. Once the clusters are found, they are automatically labelled based on the most connected node in the cluster. However, we strongly recommend that you to rename these communities yourself to highlight what these communities specify in your context. Finally, you can view the list of all the nodes that belongs to a certain cluster and download it as a CSV file.
Cluster labels on the network map
In Graph Commons, you’ll notice the cluster labels are also placed on the map visually. You can move them around and change their size in order to make the network more readable.
When you mouse over a cluster label, it will be highlighted, this way you can clearly see its boundaries and where it is located the larger picture. Cluster labels on the map provide an overview for a complex network that is otherwise hard to grasp visually.
Bridges between clusters
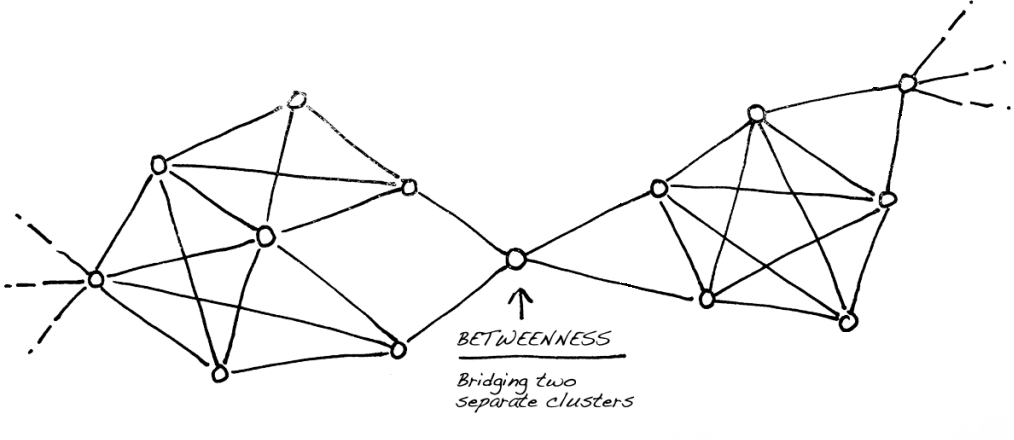
Within the clusters of a complex network, we often see few nodes making connections to other clusters besides their neighbouring nodes, whose connections are only local, within their immediate cluster. Those nodes that are bridging connections among multiple clusters have high betweenness centrality. Such bridging nodes between two or more clusters become distinctly visible with the help of the network layout algorithms.
If we are analyzing a social network, these bridging people are well-positioned to be information brokers, since they have access to information flowing in other clusters. They are the ones who carry the gossip from one group of people to another. They are in a position to combine variety of knowledge and ideas found in multiple groups. On the other hand, bridging nodes have more likelihood of being a single point of failure. If a bridge person disappears, those formerly connected communities would disconnect.
To read the whole article, with illustrations, click here.

