Originally posted here.
From detecting anomalies to understanding what are the key elements in a network, or highlighting communities, graph analytics reveal information that would otherwise remain hidden in your data. We will see how to integrate your graph analytics with Linkurious Enterprise to detect and investigate insights in your connected data.
What is graph analytics
Definition and methods
Graph analytics is a set of tools and methods aiming at extracting knowledge from data modeled as a graph. The graph paradigm is ideal to make the best out of connected data, which value resides for the most part in its relationships. But even with data modeled as a graph, extracting knowledge and providing insights can be challenging. Faced with multi-dimensional data and very large datasets, analysts need tools to accelerate the discovery of insights.
The field of graph theory has spawned multiple algorithms that analysts can rely on to find insights hidden in graph data. Below are the some of the popular graph algorithms and how they can help find insights for use-cases such as fraud, network management, anti-money, intelligence analysis or cybersecurity:
- Pattern matching algorithms allow to identify one or several subgraphs with a given structure within a graph. Example: A company node with the country property containing “Luxembourg” connected to at least five officer nodes with a registered address in France.
- Traversal and pathfinding algorithms determine paths between nodes within the graph, without knowing what connections exist or how many of them separate the two nodes. In money laundering investigations, path analysis can help determine how money flows through a network of individuals, how it goes from company A to person B. Example: the shortest path algorithm.
- Connectivity algorithms find the minimum number of nodes or edges that need to be removed to disconnect the remaining nodes from each other. It is helpful to determine weaknesses in an IT network for instance and find out which infrastructure points are sensitive and can take it down. Example: the Strongly Connected Components algorithm
- Community detection algorithms identify clusters or groups, of nodes densely connected within the graph. This is particularly helpful to find groups of people that might belong to a common criminal organization. Example: the Louvain method, the label propagation algorithm.
- Centrality algorithms determine a node’s relative importance within a graph by looking at how connected it is to other nodes. It is used for instance to identify key people within organizations. Example: the PageRank algorithm, degree centrality, closeness centrality, betweenness centrality
Architecture blueprint for graph analytics
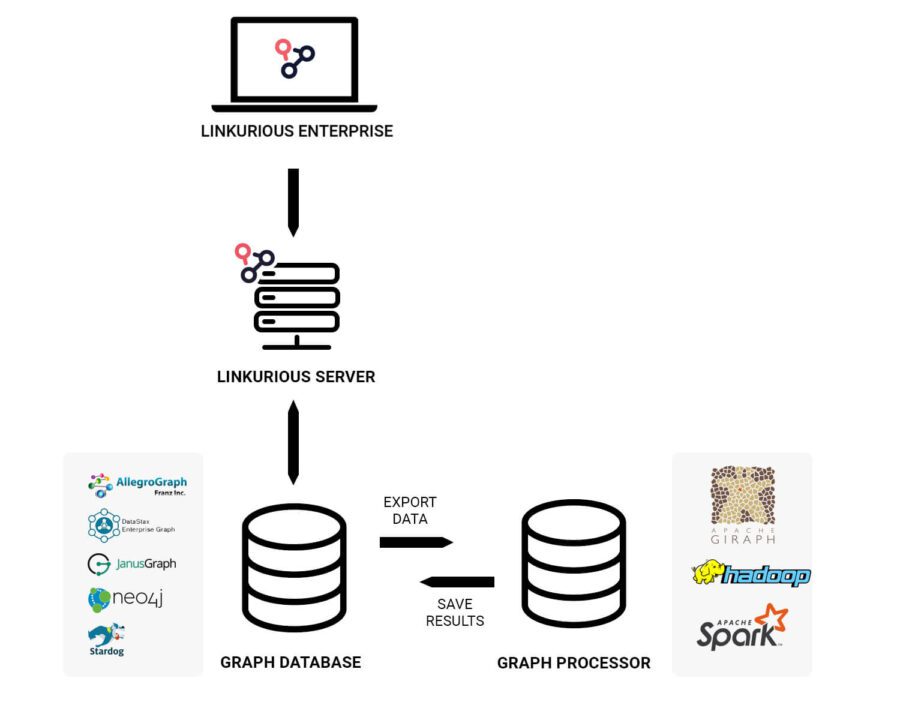
Depending on your data, your use-case, and the questions you have to answer, technology and infrastructure can differ from one organization to another. But a generic graph analytics architecture usually consists of the following layers:
- Linkurious Enterprise: the browser-based platform and its server are used by investigation teams to visualize and analyze graph data. It retrieves data in real-time from graph databases.
- Graph databases: transactional systems storing data as graphs and managing operations such as data retrieval or writing. They perfectly handle real-time queries, making them great online transaction processing (OLTP) systems.
- Graph processing systems: a set of analytical engines shipping with common graph algorithms and handling large-scale online analytical processing (OLAP) on graphs.

Architecture blueprint for graph analytics
Linkurious Enterprise acts as a front-end where analysts and investigators can easily retrieve information. The data accessed by Linkurious Enterprise is stored in a graph database. Graph databases are well suited for real-time querying and long-term persistence but are usually not designed for running complex graph algorithms at scale. As a result, our clients tend to push this sort of workload to dedicated graph processing frameworks such as Spark/GraphX. The results are then persisted back in the graph database as new properties (eg a PageRank score property for example) and thus become available to Linkurious Enterprise.
Applying graph analytics to the Paradise Papers data
In this section, we take a closer look at a real-life graph dataset, the Paradise Papers dataset, created by the ICIJ to investigate the world offshore finance industry. We use Linkurious Enterprise to query, analyze and visualize the data using graph analytics tools and methods.
The setup

The setup used in our example
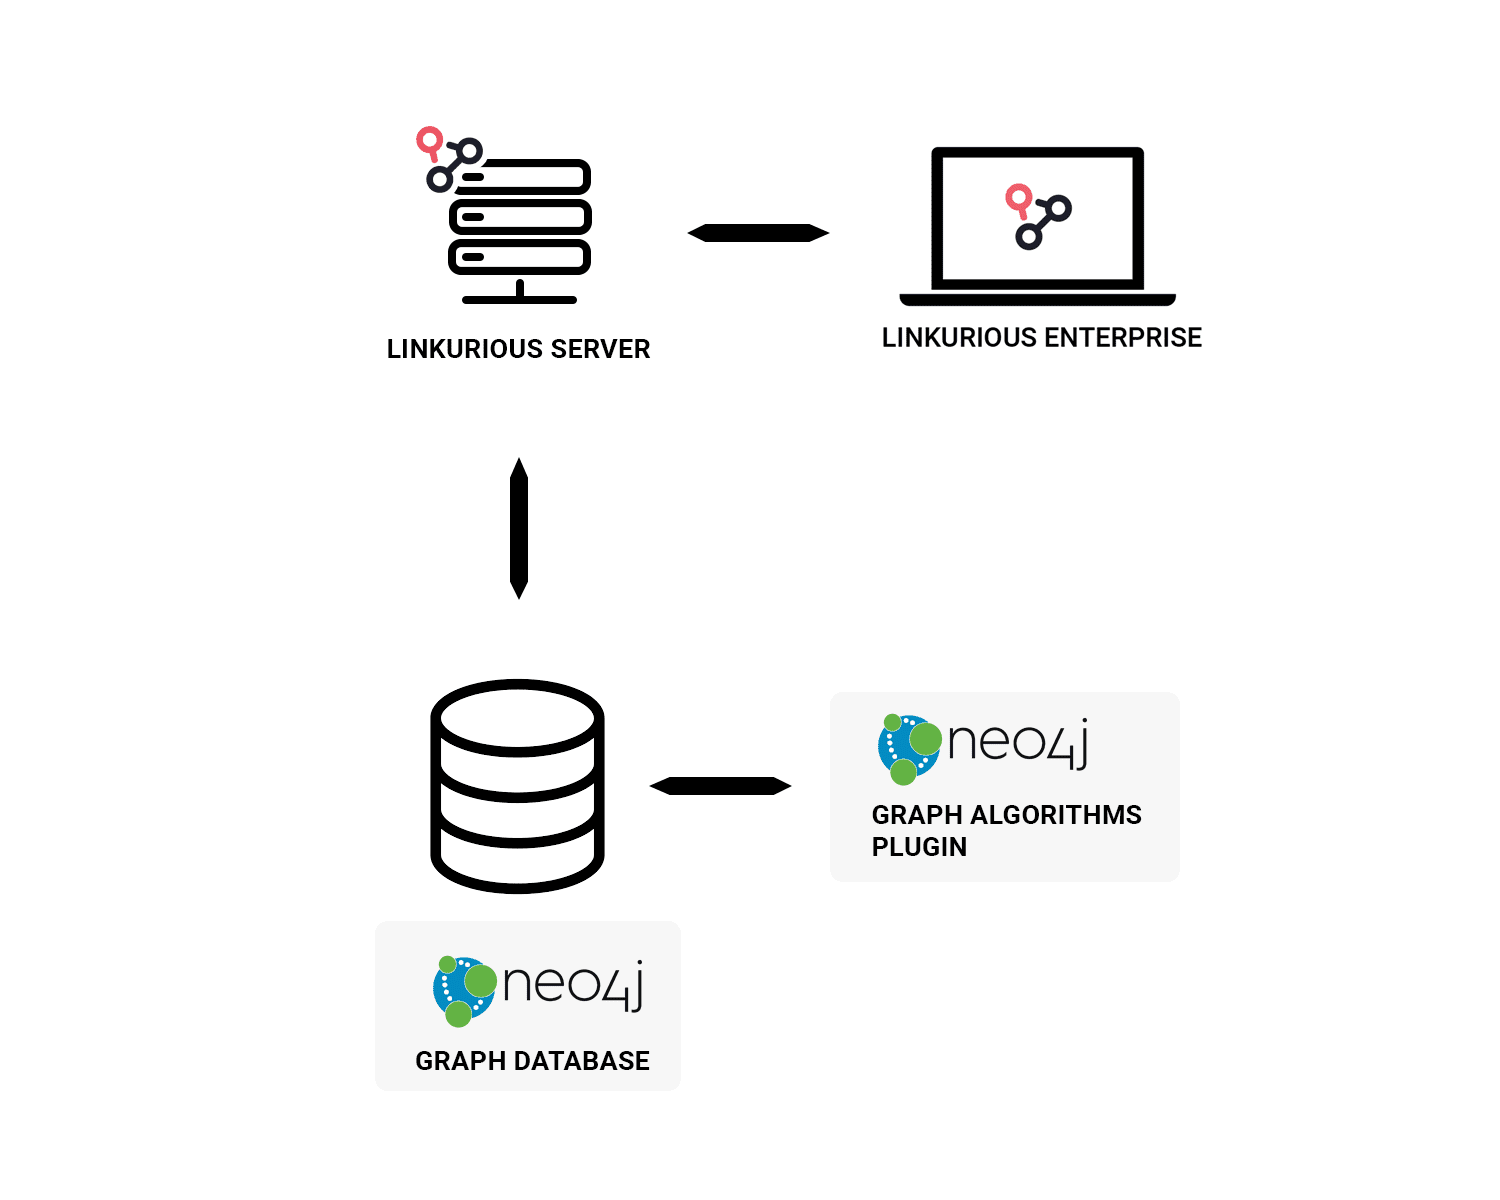
For the purpose of this example, we relied on the architecture pictured above:
- A Linkurious Enterprise instance
- A Neo4j graph database
- The Neo4j graph algorithms library, a plugin that provides parallel versions of common graph algorithms for Neo4j exposed as Cypher procedures.
The Paradise Papers dataset
The dataset is made of 1,582,953 nodes and 2,398,680 edges. It aggregates data from four investigations of the ICIJ: the Offshore Leaks, the Panama Papers, the Bahamas Leaks and the Paradise Papers.
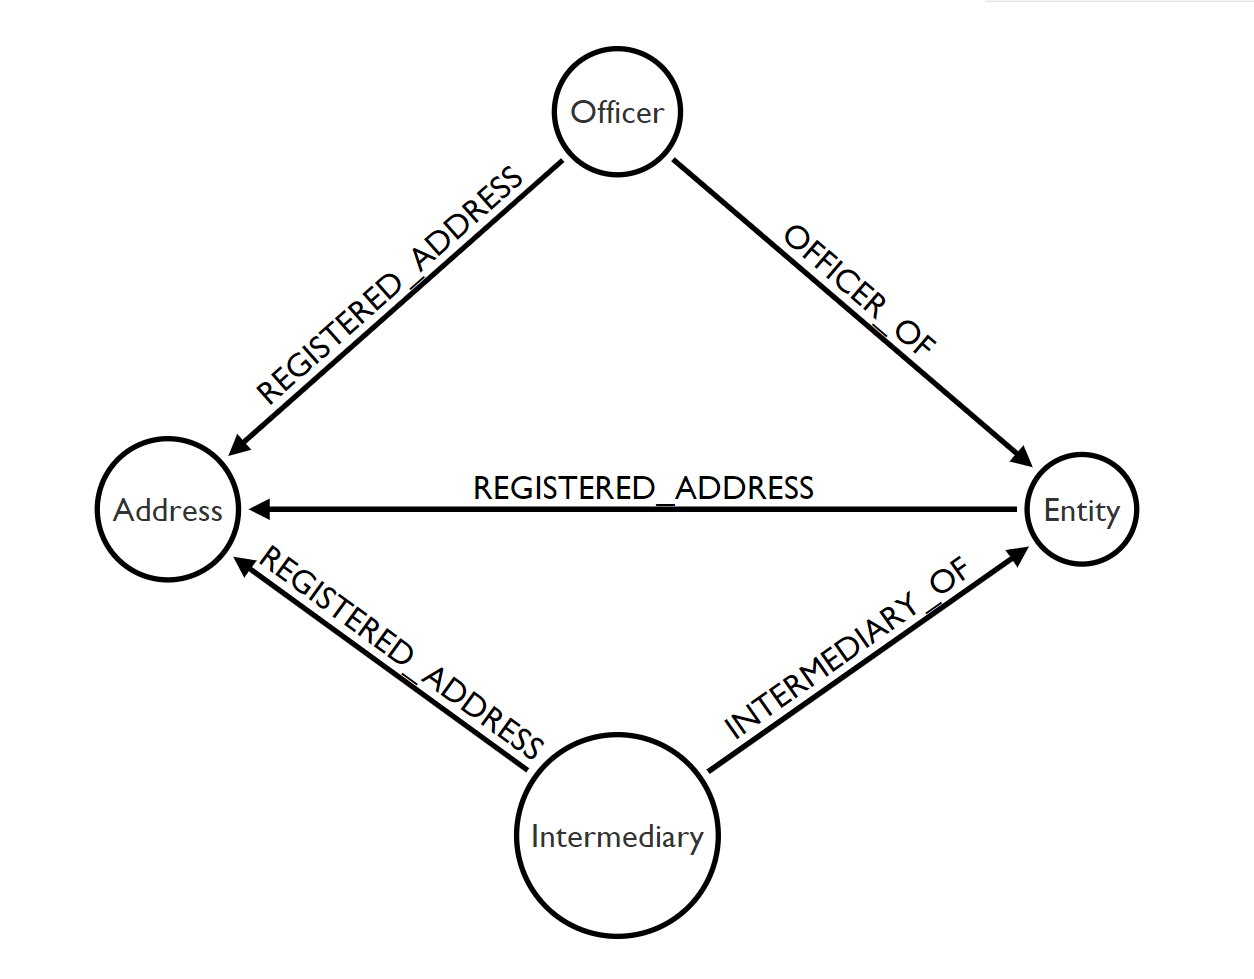
The graph data model has four types of nodes and three types of edges as depicted below.

Graph data model of the Paradise Papers dataset
In the following sections, we will see how to use different graph analytics approaches such as graph pattern matching, PageRank analysis, and the Louvain community detection method. While implementing graph analytics requires some technical knowledge, we will see how Linkurious Enterprise can make graph analytics results accessible to every analyst via simple tools. Among these tools are query templates, an alert dashboard, and a visualization interface.
Graph pattern matching in Linkurious Enterprise
A simple method for identifying patterns in a graph is to use graph languages to describe the shape of the data you are looking for. As a developer, you can do it in the interface of your favorite graph database but also within the Linkurious Enterprise interface.
What if you want to be warned every time a certain graph pattern appears in your data? Via the Linkurious Enterprise alert system, you set up alerts for graph patterns you want to monitor. Every time a new match is detected in the database, it’s recorded and available for users to review. This is useful in a fraud monitoring context for instance where you’d want to be notified when instances of known fraud schemes occur.
In the video below, we set up a new alert in Linkurious Enterprise for a specific pattern. The alert contains a graph query looking for addresses tied to more than five entities or company officers.
Once the alert is saved, users access a match list and can start investigating the results. Below, we review one of the findings from the alert investigation interface.
When looking at a node representing a company, you may want to know what are all the other companies it is sharing the same addresses with. The answer can be retrieved manually, by expanding and filtering the data. Or it can be retrieved via a graph query, which requires technical skills. With Linkurious Enterprise’ query templates, you can apply pre-formatted graph queries with the click of a button and accelerate your data exploration. Users run query templates by right-clicking on a node in the visualization and choosing the desired template from the menu.
Below is an example of how to set up a query template. We configure it to retrieve, for a given company officer, all the other officers it is connected to via a shared address or a shared company.
Once the query is configured, users can easily access and run it from the visualization interface to speed up their investigations.
In addition to these features, users can rely on Linkurious Enterprise styling and filtering capabilities to analyze the data faster. Once the results of the query are displayed, styles and filters are essential to refine the results, reduce the noise and highlight the key elements.
In the next section, we see how to automate the identification of unusual companies within the French network using the PageRank algorithm and Linkurious Enterprise’s alert system.
Identifying key nodes with the PageRank algorithm
To use graph algorithms in Linkurious Enterprise, you will first need to run them on your backend and save their results as new properties in your graph database. In this example, we show how to identify key nodes in your network using the PageRank algorithm. This centrality algorithm will compute a score assessing the relative importance of various nodes within a network.
One line of code is enough to run the algorithm in Neo4j and create a new node property, “pagerank_g” with the resulting PageRank score.
| // Computation of PageRank CALL algo.pageRank(null,null,{write:true,writeProperty:’pagerank_g’}) |
Once this has been added to our graph, we can start exploiting the results in Linkurious Enterprise.
We created a new alert, leveraging the PageRank results. The query is simple: it searches for Entity nodes connected to other nodes (Countries, Officer, Intermediary) located in France. It also collects their PageRank scores and ranks them by order of importance. Every matching sub-graph is recorded by the alert system and can be investigated. By sorting results by their PageRank scores, we can focus our investigation on the most important companies within the French network.
| // Detect French entities with a high PageRank
MATCH (a:Entity)-[r]-(b) |
In the example below, we review one of the top matches recorded by the alert system.
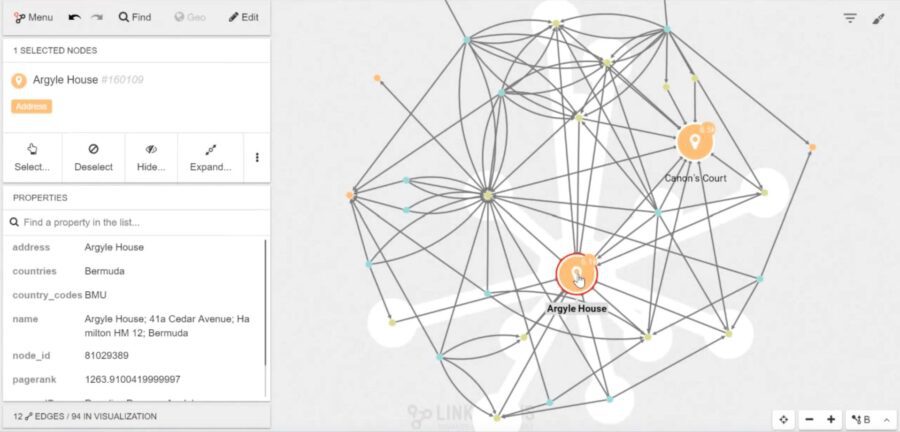
In addition to these features, users can rely on Linkurious Enterprise styling and filtering capabilities to analyze the data faster. For instance, it’s possible to size and filter the nodes based on their PageRank score to get a faster understanding of the situations as depicted in the image below.

A size is applied to “location” nodes based on their PageRank score to highlight nodes of importance.
By enriching the data with additional information, the PageRank algorithm helped us focus on nodes of interest. The alert system in Linkurious Enterprise helps us classify the results and provides a user-friendly interface for investigation. In the next section, we see how to detect community of interest with a single click using the Louvain algorithm and the query template system.
Identifying interesting communities via the Louvain modularity
In the example below, we implement the Louvain algorithm to identify communities within our network. We look specifically at communities of company officers based on their relationships. The snippet of code below identifies communities and adds a new property “communityLouvain” property to each node, representing the community it belongs to.
| // Computation of Louvain modularity
CALL algo.louvain( |
Then, we leverage the data generated by the algorithm in a query template to retrieve in a click for a given “Officer” node, the other officers belonging to the same community. Instead of manually exploring each of the nodes’ neighbors to identify a potential community, the query template instantly provides an answer the analysts can then refine. Below is the code used in the query template.
| //Retrieve the officer nodes who belong to the same community
MATCH (a:Officer) |
We can now retrieve, in a click, officers of the same community from any given officer in the visualization interface. In the example below, we apply this to Boris Rotemberg, a Russian oligarch, opening an investigation on his close connections. Once the results of the query are displayed, styles and filters are essential to refine the results, reduce the noise and highlight the key elements.
Graph analytics and graph visualization are complementary. The existing graph analytics tools and methods make it possible to extract information from large amounts of connected data, generating valuable insights.
With platforms like Linkurious Enterprise, every user can take advantage of graph analytics from their browser via an intuitive interface. From detecting financial crimes, such as money laundering or tax evasion, to spotting fraud, or fighting organized crime, analysts find the insights they need.
DSC Resources
- Book and Resources for DSC Members
- Comprehensive Repository of Data Science and ML Resources
- Advanced Machine Learning with Basic Excel
- Difference between ML, Data Science, AI, Deep Learning, and Statistics
- Selected Business Analytics, Data Science and ML articles
- Hire a Data Scientist | Search DSC | Find a Job
- Post a Blog | Forum Questions
