
Note: Many thanks to those who provided comments on my previous blog “Features Part 1: Are Features the new Data?”. And special thanks to Somil Gupta and Harsha Srivatsa who patiently worked with me to clarify many of my thoughts on the subject. Yea, some of my thoughts are a bit whacky, but life should be a bit whacky if we want to learn new things.
My blog “Features Part 1: Are Features the new Data?” created quite a stir, and lots of learning for me! In that blog, I proposed the “Data-to-Features-to-ML Models-to-Use Cases” topology that highlighted the need to integrate the disciplines of Data Management, Data Engineering, Feature Engineering, Data Science, and Value Engineering (Figure 1).
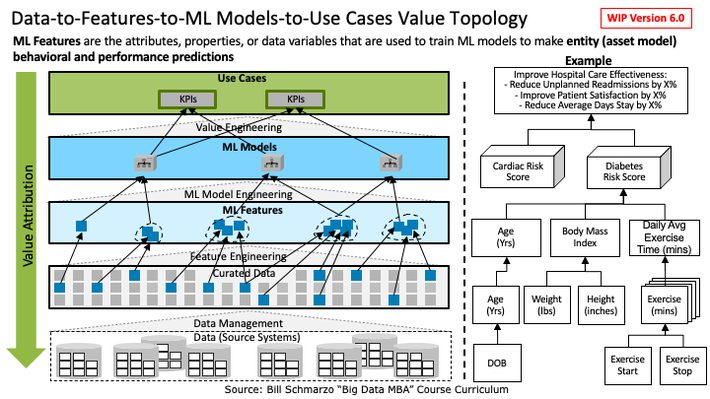
Figure 1: “Data-to-Features-to-Use Cases” Value Topology
Yea, Figure 1 was sort of a mess. I erred in trying to cram too much into a single slide. So, let’s deconstruct Figure 1 into 3 new slides to support my original points on features:
- Features[1] are a higher-level data construct created by mathematically transformations of curated data elements that ML models use during training and inference to make predictions.
- Not all Features are of equal value. Some features are more important than other features in driving ML model predictive accuracy and precision (and that we can use advanced algorithms like Random Forest, Principal Component Analysis, and Shapley Additive Explanations[2] to make those determinations).
- Features are Economic Assets that can be shared, reused, and continuously refined across an unlimited number of ML model to support an unlimited number of business and operational use cases (Feature Stores).
Let’s start the deconstruction process.
Step 1: Clarifying the Data-to-Features-to-Use Case Value Topology
The first thing in deconstructing Figure 1 is to just show the relationships between the different data and analytic constructs that are used to help organizations optimize their key business and operational use cases (Figure 2).
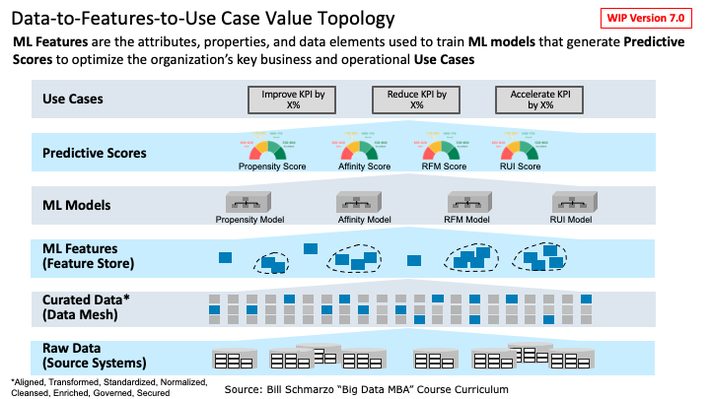
Figure 2: “Data-to-Features-to-Use Case” Value Topology
As depicted in Figure 2:
- Raw Data (structured, semi-structured, and unstructured data) from a variety of internal and external data sources are gathered, aligned, transformed, standardized, normalized, cleansed, enriched, governed, and secured as Curated Data (using data management techniques and tools) within the organization’s officially blessed data repository (data warehouse, data lake, data swamp, data mesh, data WTF).
- ML Features are mathematical transformations of Curated Data variables that are used by ML Models during training and inference to make predictions (typically about the organization’s key individual human and/or device entities).
- ML Models create predictions of what is likely to happen (using analytic constructs like Predictive Scores) that are used to optimize the decisions that support the organization’s key business and operational Use Cases.
- Use Cases are the source of organizational value creation, in that there is attributable value in the optimization (reduce, increase, optimize, rationalize, etc.) of the KPIs against which the organization measures the effectiveness of their value creation processes.
Note: there is nothing to prevent the mathematical transformation (and blending) of existing features to create newer, higher-level features. That supports features as economic assets that can be shared, reused, and continuously refined, which I’ll talk more about in a future blog.
Step 2: Data-to-Features-to-Use Case Value Topology Healthcare Example
Let’s now apply the value topology depicted in Figure 2 to a healthcare example.
Let’s say that you are a healthcare provider (hospital), and you are seeking to apply data and analytics to optimize the organization’s key operational use cases of reducing unplanned hospital readmissions, improving patient satisfaction, and reducing average days stay. We apply the “Thinking Like a Data Scientist” methodology (hint-hint-hint) to bring the domain experts into the feature engineering and ML model development processes to create Cardiac Risk and Diabetes Risk predictive scores that we can apply at the individual patient level to make individual patient and care decisions to reduce unplanned hospital readmissions, improve patient satisfaction, and reduce average days stay (Figure 3).
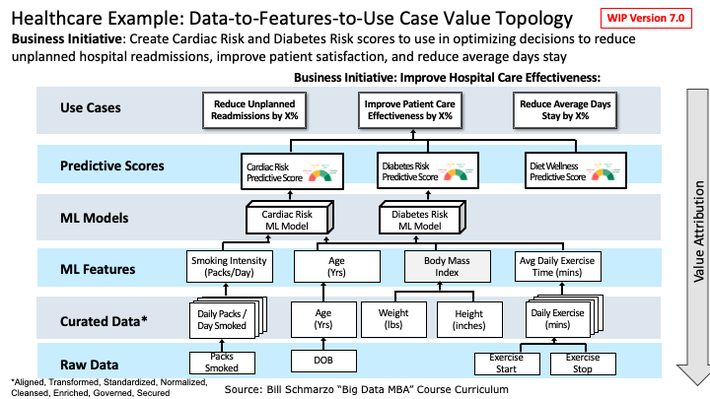
Figure 3: Healthcare Provider Example of Data-to-Features-to-Use Case Value Topology
From Figure 3, we can see the following data and feature relationships:
- Raw data is captured from a variety of internal and external data sources, and is then aligned, transformed, standardized, normalized, cleansed, enriched, governed, and secured to be transformed into curated, trusted data.
- We mathematically transform curated data to create features such as Age (years), Body Mass Index, Average Daily Exercise Time (minutes), and Smoking Intensity (# of Packs per day).
- The various Features are used by different ML models (which mathematically transforms and integrates different combinations, weights, and biases of the features[3]) to generated Predictive Scores. For example, think of how a Credit Score, which is a measure of someone’s likelihood to repay a loan, is used to make loan approval decisions, loan terms decisions, credit card acceptance decisions, rental decisions, and even hiring decisions.
- These Predictive Scores are then used by decision makers (both human and machine) to optimize decisions around reducing unplanned hospital readmissions, improving patient satisfaction, and reducing average days stay in support of the Hospital’s “Improve Patient Care Effectiveness” business initiative.
Step 3: Defining the Modern-Day Data Management Discipline
The final step in deconstructing Figure 1 is to define a more holistic “Data Management” discipline to activate the Data-to-Features-to-Use Case value topology (Figure 4).
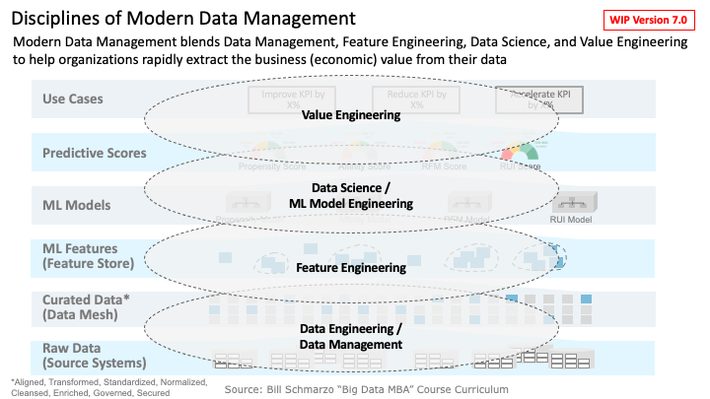
Figure 4: Expanding the Discipline of Modern Data Management
I’m a firm believer – and reflect that belief in my writings and teachings – that we need to “up the stakes” with respect to how we reinvent data management into a critical business discipline necessary to support today’s data economy (see my blog “Reframing Data Management: Data Management 2.0“). I believe that the modern data management discipline requires the blending of the following loosely coupled data and analytic practices:
- Data management is the practice of ingesting, storing, organizing, maintaining, and securing the data created and collected by an organization.
- Data engineering is the practice of aggregating, preparing, wrangling[4], munging[5], and making raw data usable to the downstream data consumers (management reports, operational dashboards, business analysts, data scientists) within an organization.
- Feature engineering is the practice of selecting and mathematically transforming data variables or data elements to create ML Features that are used to create predictive models using machine learning or statistical modeling (such as deep learning, decision trees, or regression). The feature engineering practice involves collaborating with domain experts to enhance and accelerate ML model development leveraging domain experts’ heuristics, rules of thumbs, and historical judgement experience (Figure 5).
- Data Science is the practice of leveraging Feature Engineering to build ML models that identify and codify the customer, product, and operational propensities, trends, patterns, and relationships buried in the data.
- ML (Model) Engineering is the practice of integrating software engineering principles with analytical and data science knowledge to manage, monitor, operationalize, and scale ML models within the operations of the business.
- Value Engineering is the discipline of decomposing an organization’s Strategic Business Initiative into its supporting business (stakeholders, use cases, KPIs), data, and analytics components. Value Engineering determines the sources of an organization’s value creation activities and identifies, validates, values, and prioritizes the KPIs against which the effectiveness of that value creation is measured.
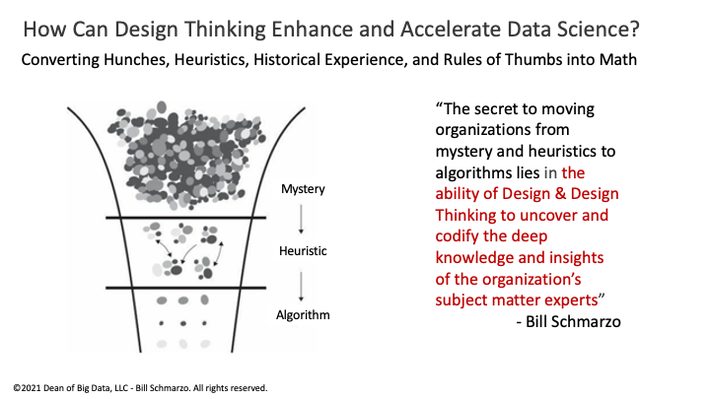
Figure 5: How Design Thinking Can Fuel Feature Engineering
One other complementary discipline that I should call out as a critical component of the modern data management discipline is Design Thinking. Design Thinking creates a culture of empowerment that democratizes ideation across domain experts and the data science team in identifying those variables, metrics, and features that might be better predictors of behaviors and performance (Figure 6).
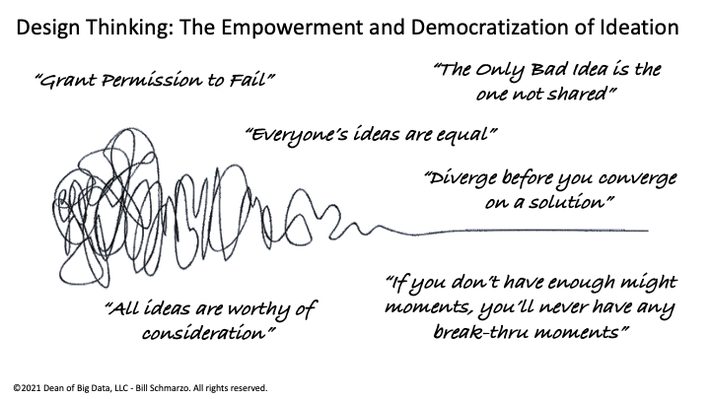
Figure 6: Design Thinking: The Empowerment and Democratization of Ideation
If features and feature engineering are a key to creating analytics that deliver relevant, meaningful, and quantifiable business outcomes, then empowering the domain experts and integrating them into the data science process early is key to success. And that’s exactly what Design Thinking (and “Thinking Like a Data Scientist”) seeks to accomplish.
Summary: Clarifying the Data-to-Features-to-Use Case Value Topology
My initial blog “Features Part 1: Are Features the new Data?” generated a maelstrom of comments, which motivated me to write this blog to clarify my original propositions on the “Data-to-Features-to-Use Cases” topology. While I hope that this blog continues to generate dialogue, comments, and more learning, I am also preparing to write two additional blogs on features:
- Are Features Economic Assets?
- What is the “Feature Value Chain”?
So, watch this space for more on the important topic of features.
[1] Note: Features are input variables or data elements used by models to make prediction (e.g., (1) women (2) under 25 (3) who smoke tobacco). Feature Selection is the process of selecting a subset of relevant features (or a feature set) for use in ML model construction.
[2] Shapley Additive Explanations supports Feature Importance which helps you estimate how much each feature of your data contributed to the ML model’s prediction accuracy and precision.
[3] Weights and biases are the learnable parameters of some machine learning models, including neural networks. Weights control the signal (or the strength of the connection) between two neurons or nodes. In other words, a weight decides how much influence the input will have on the output.
[4] Data Wrangling the process of cleaning, structuring, and enriching raw data into a desired format for better decision making
[5] Data munging is the process of transforming and mapping data from one “raw” data format into another format with the intent of making it more appropriate and valuable for a variety of downstream purposes such as analytics
