There are many ways chaos is defined, each scientific field and each expert having its own definitions. We share here a few of the most common metrics used to quantify the level of chaos in univariate time series or data sets. We also introduce a new, simple definition based on metrics that are familiar to everyone. Generally speaking, chaos represents how predictable a system is, be it the weather, stock prices, economic time series, medical or biological indicators, earthquakes, or anything that has some level of randomness.
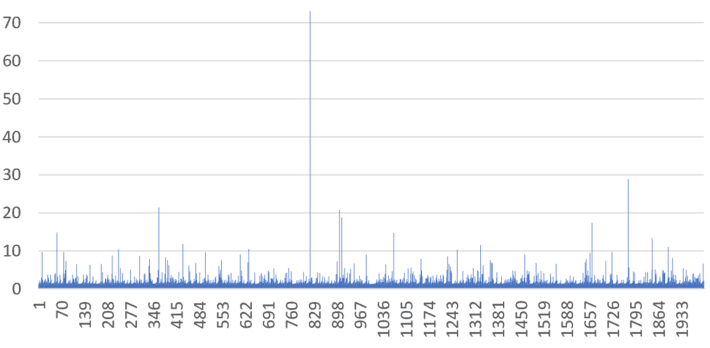
In most applications, various statistical models (or data-driven, model-free techniques) are used to make predictions. Model selection and comparison can be based on testing various models, each one with its own level of chaos. Sometimes, time series do not have an auto-correlation function due to the high level of variability in the observations: for instance, the theoretical variance of the model is infinite. An example is provided in section 2.2 in this article (see picture below), used to model extreme events. In this case, chaos is a handy metric, and it allows you to build and use models that are otherwise ignored or unknown by practitioners.

Figure 1: Time series with indefinite autocorrelation; instead, chaos is used to measure predictability
Below are various definitions of chaos, depending on the context they are used for. References about how to compute these metrics, are provided in each case.
Hurst exponent
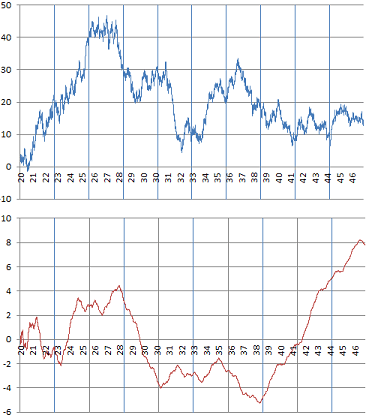
The Hurst exponent H is used to measure the level of smoothness in time series, and in particular, the level of long-term memory. H takes on values between 0 and 1, with H = 1/2 corresponding to the Brownian motion, and H = 0 corresponding to pure white noise. Higher values correspond to smoother time series, and lower values to more rugged data. Examples of time series with various values of H are found in this article, see picture below. In the same article, the relation to the detrending moving average (another metric to measure chaos) is explained. Also, H is related to the fractal dimension. Applications include stock price modeling.

Figure 2: Time series with H = 1/2 (top), and H close to 1 (bottom)
Lyapunov exponent
In dynamical systems, the Lyapunov exponent is used to quantify how a system is sensitive to initial conditions. Intuitively, the more sensitive to initial conditions, the more chaotic the system is. For instance, the system xn+1 = xn – INT(xn), where INT represents the integer function, is very sensitive to the initial condition x0. A very small change in the value of x0 results in values of xn that are totally different even for n as low as 45. See how to compute the Lyapunov exponent, here.
Fractal dimension
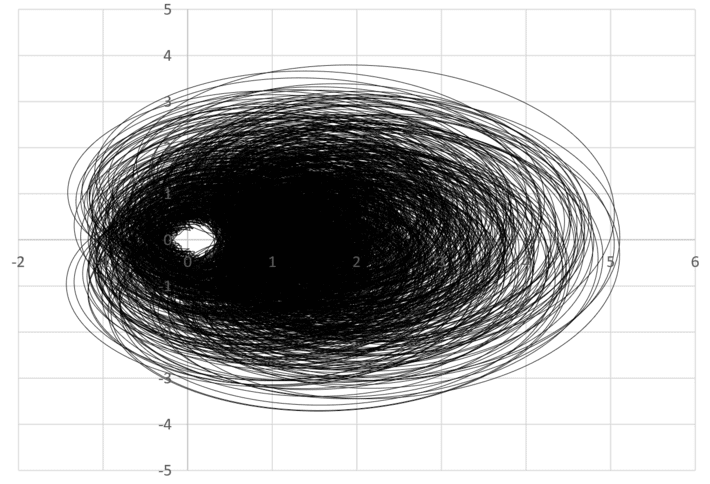
A one-dimensional curve can be defined parametrically by a system of two equations. For instance x(t) = sin(t), y(t) = cos(t) represents a circle of radius 1, centered at the origin. Typically, t is referred to as the time, and the curve itself is called an orbit. In some cases, as t increases, the orbit fills more and more space in the plane. In some cases, it will fill a dense area, to the point that it seems to be an object with a dimension strictly between 1 and 2. An example is provided in section 2 in this article, and pictured below. A formal definition of fractal dimension can be found here.

Figure 3: Example of a curve filling a dense area (fractal dimension > 1)
The picture in figure 3 is related to the Riemann hypothesis. Any meteorologist who sees the connection to hurricanes and their eye, could bring some light about how to solve this infamous mathematical conjecture, based on the physical laws governing hurricanes. Conversely, this picture (and the underlying mathematics) could also be used as statistical model for hurricane modeling and forecasting.
Approximate entropy
In statistics, the approximate entropy is a metric used to quantify regularity and predictability in time series fluctuations. Applications include medical data, finance, physiology, human factors engineering, and climate sciences. See the Wikipedia entry, here.
It should not be confused with entropy, which measures the amount of information attached to a specific probability distribution (with the uniform distribution on [0, 1] achieving maximum entropy among all continuous distributions on [0, 1], and the normal distribution achieving maximum entropy among all continuous distributions defined on the real line, with a specific variance). Entropy is used to compare the efficiency of various encryption systems, and has been used in feature selection strategies in machine learning, see here.
Independence metric
Here I discuss some metrics that are of interest in the context of dynamical systems, offering an alternative to the Lyapunov exponent to measure chaos. While the Lyapunov exponents deals with sensitivity to initial conditions, the classic statistics mentioned here deals with measuring predictability for a single instance (observed time series) of a dynamical systems. However, they are most useful to compare the level of chaos between two different dynamical systems with similar properties. A dynamical system is a sequence xn+1 = T(xn), with initial condition x0. Examples are provided in my last two articles, here and here. See also here.
A natural metric to measure chaos is the maximum autocorrelation in absolute value, between the sequence (xn), and the shifted sequences (xn+k), for k = 1, 2, and so on. Its value is maximum and equal to 1 in case of periodicity, and minimum and equal to 0 for the most chaotic cases. However, some sequences attached to dynamical systems, such as the digit sequence pictured in Figure 1 in this article, do not have theoretical autocorrelations: these autocorrelations don’t exist because the underlying expectation or variance is infinite or does not exist. A possible solution with positive sequences is to compute the autocorrelations on yn = log(xn) rather than on the xn‘s.
In addition, there may be strong non-linear dependencies, and thus high predictability for a sequence (xn), even if autocorrelations are zero. Thus the desire to build a better metric. In my next article, I will introduce a metric measuring the level of independence, as a proxy to quantifying chaos. It will be similar in some ways to the Kolmogorov-Smirnov metric used to test independence and illustrated here, however, without much theory, essentially using a machine learning approach and data-driven, model-free techniques to build confidence intervals and compare the amount of chaos in two dynamical systems: one fully chaotic versus one not fully chaotic. Some of this is discussed here.
I did not include the variance as a metric to measure chaos, as the variance can always be standardized by a change of scale, unless it is infinite.
To receive a weekly digest of our new articles, subscribe to our newsletter, here.
About the author: Vincent Granville is a data science pioneer, mathematician, book author (Wiley), patent owner, former post-doc at Cambridge University, former VC-funded executive, with 20+ years of corporate experience including CNET, NBC, Visa, Wells Fargo, Microsoft, eBay. Vincent is also self-publisher at DataShaping.com, and founded and co-founded a few start-ups, including one with a successful exit (Data Science Central acquired by Tech Target). You can access Vincent’s articles and books, here.
