This article was written by Jason O’Rawe on ODSC. Jason is an ODSC data science team contributor.
Twitter is an indispensable resource for data scientists as well as for the broader data science community. With the right connections, you can use twitter to learn data science, discover new technologies, computational tools and methodologies, and you can contribute to and build a community of data scientists working for the social good.
Indeed, we at the ODSC use twitter to spread the word about the great data science speakers and workshops happening conference events like ODSC East. With a good twitter list, however, you can bring much of value and content that comes with attending an influential meeting like ODSC East directly to your twitter feed!
Data science is a highly diverse and interdisciplinary field, but does data science twitter chatter reflect its interdisciplinary nature? Are there distinct communities of data scientists that interact with and cater to distinct sub-fields? To begin seeking an answer to this question, we will walk you through the simple analysis of a weeks worth data science related tweets.
A data science twitter network
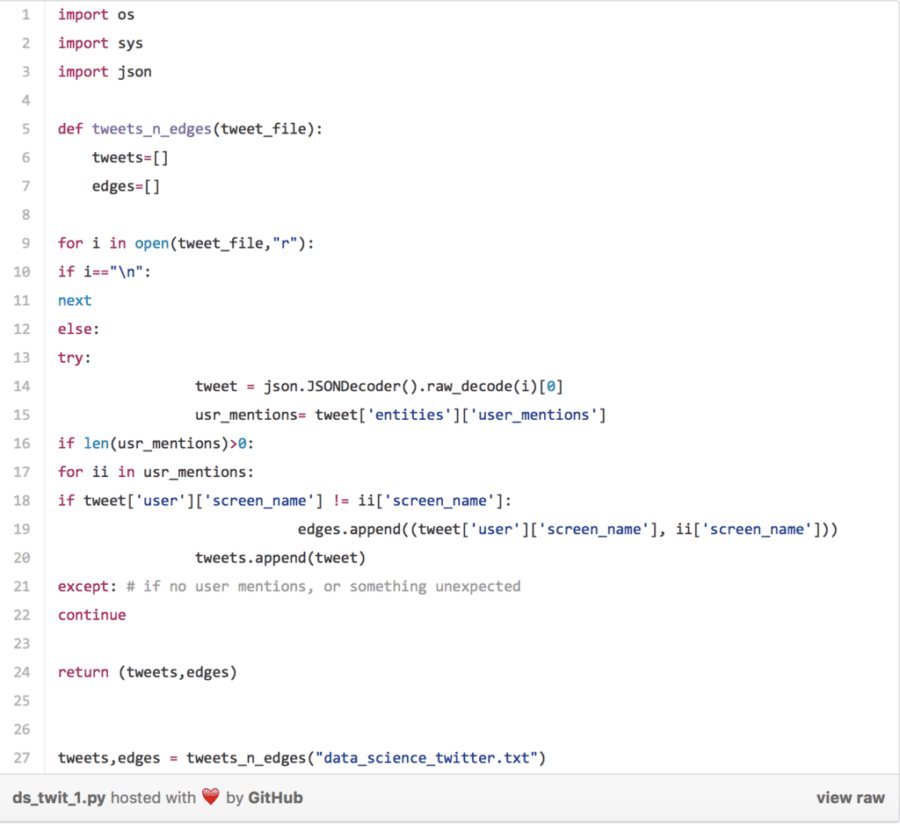
Tweets were collected using a tweepy listener (see here1 for a tutorial on building a twitter listener), and stored in a text file named “data_science_twitter.txt”. Let’s first load the tweets and extract user mentions to take a quick look at the volume of data science tweets from this week.

Tweets and network edges (links between twitter users) were gathered based on user mentions. How many tweets and user mentions were there?

There are 159600 tweets about data science this week, and 162070 user mentions!
The data science twitter community is incredibly active; we saw almost 160,000 tweets within a single week! And, there seems to be just as much interaction within the community, as there is about the same number of user mentions, not including self-mentions.
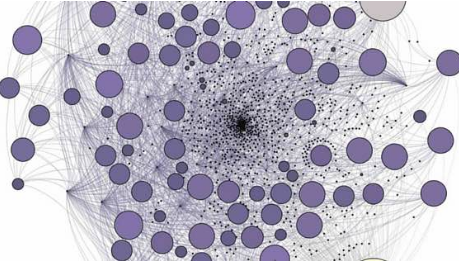
But what does the network look actually like? To build a network and find the most influential data science twitter uses, we will use the NetworkX package to create a directed graph and to calculate eigenvector centrality (a measure of network influence) among the nodes (twitter users). The resulting network is plotted using Gephi.
To read more, click here.
Top DSC Resources
- Article: What is Data Science? 24 Fundamental Articles Answering This Question
- Article: Hitchhiker’s Guide to Data Science, Machine Learning, R, Python
- Tutorial: Data Science Cheat Sheet
- Tutorial: How to Become a Data Scientist – On Your Own
- Categories: Data Science – Machine Learning – AI – IoT – Deep Learning
- Tools: Hadoop – DataViZ – Python – R – SQL – Excel
- Techniques: Clustering – Regression – SVM – Neural Nets – Ensembles – Decision Trees
- Links: Cheat Sheets – Books – Events – Webinars – Tutorials – Training – News – Jobs
- Links: Announcements – Salary Surveys – Data Sets – Certification – RSS Feeds – About Us
- Newsletter: Sign-up – Past Editions – Members-Only Section – Content Search – For Bloggers
- DSC on: Ning – Twitter – LinkedIn – Facebook – GooglePlus
Follow us on Twitter: @DataScienceCtrl | @AnalyticBridge

