
One of my career breakthroughs occurred when I was teaching at the University of San Francisco School of Management. I kicked off a research project to determine how to treat data as an asset on a company’s balance sheet. My aha moment occurred when one of my research assistants made the following comment:
“Data isn’t like anything else on the balance sheet. Data never wears out, never depletes, and can be used over and over again at zero marginal cost.”
The lightbulb went off – this wasn’t a finance or accounting conversation. No, it was an economics conversation. As explained in Adam Smith’s groundbreaking book “Wealth of Nations”[1], Finance and accounting use a “value in exchange” asset valuation methodology, but Economics uses a “value in use” asset valuation methodology,
This revelation that this was an economics play immediately opened up new perspectives on how organizations could leverage data and AI for value creation, or put in another way:
“How effective is your organization at leveraging data and analytics to power your business models?”
One important consequence was the opportunity to build upon one of the most powerful economic concepts – the economic multiplier effect[2]. Expanding on the fundamental concepts that underpin the powerful economic multiplier effect yielded the data economic multiplier effect.
Data Economic Multiplier Effect: data and analytic assets can multiply their value as they are reapplied beyond their initial use case to other use cases at near-zero marginal cost.
By understanding and activating the data economic multiplier effect, organizations can accelerate their ability to leverage their data to generate new sources of customer, product, service, operational, and societal value through a use case-based, business-centric approach.
Let’s examine an example of the retail industry. I will also provide the ChatGPT prompt at the end of this blog, which you can use to recreate this example for your industry.
Retail Industry Building Block #1: Improve Customer Retention Use case
Let’s say the retailer has decided that its most important use case is Improving Customer Retention. This use case can yield business benefits, including increasing customer loyalty, reducing churn, enhancing customer satisfaction, providing personalized experiences, and proactively addressing customer needs and concerns.
The most critical data set supporting this use case is the customer transaction or point-of-sale (POS) data. This data set contains details about every customer purchase transaction, such as location, date, time, items bought, price paid, discounts applied, payment method, loyalty program participation, salesperson details, transaction ID, return and exchange data, promotional offers, sales tax, purchase channel (in-store, online, mobile), and basket size.
But wait, there is more. That same customer transaction / POS data set can now be used for several additional customer-centric use cases beyond improving customer retention, such as those listed in Table 1.
| Use Case | Description | Desired Outcomes |
| à Improve Customer Retention | Predict which customers are likely to stop purchasing products | Reduced churn rate, proactive customer retention, personalized re-engagement campaigns, increased loyalty, improved satisfaction |
| Customer Segmentation | Categorize customers based on purchase behavior | Increased marketing ROI, personalized offers, improved customer retention, targeted advertising, enhanced customer experience |
| Personalized Marketing Campaigns | Create tailored promotions for different customer segments | Higher conversion rates, increased sales, better customer engagement, reduced marketing costs, higher customer lifetime value |
| Customer Lifetime Value Prediction | Predict future value of customers | Prioritized customer service, targeted retention efforts, optimized resource allocation, increased profitability, reduced churn |
| Market Basket Analysis | Identify frequently bought together items | Improved product bundling, increased average order value, optimized store layout, better cross-selling, higher sales volume |
| Sales Forecasting | Predict future sales based on historical data | Optimized inventory levels, reduced stockouts, better demand planning, increased sales, reduced holding costs |
| Promotional Effectiveness | Measure the impact of marketing campaigns on sales | Optimized marketing spend, improved ROI, better promotional planning, increased sales, enhanced customer targeting |
| Customer Sentiment Analysis | Analyze customer reviews and feedback | Improved product quality, enhanced customer satisfaction, reduced negative feedback, better service, increased retention |
| Price Sensitivity Analysis | Determine customer response to price changes | Optimized pricing strategy, increased profit margins, better demand forecasting, improved customer satisfaction, increased sales |
| Seasonal Trends Analysis | Identify seasonal patterns in sales | Optimized inventory management, better promotional planning, increased sales, reduced stockouts, improved resource planning |
And here’s the breakthrough effect: I can reuse that same POS data set at zero marginal cost to support the analytics development that supports these additional use cases. This is the data economic multiplier effect in action!
Retail Industry Building Block #2: Stock Level Optimization
The organization has decided on Stock-level Optimization as its next most important use case. Stock-level optimization ensures optimal inventory levels by analyzing demand patterns and sales data to minimize stockouts and excess inventory, thereby reducing costs and improving availability.
The most valuable data set for this business challenge is inventory data. This data set includes stock levels, product details (e.g., SKU, category, expiration dates), supplier information (e.g., lead times, reliability), sales forecasts, replenishment schedules, warehouse locations, stock movements, and availability status.
But again, wait, there is more here! That inventory data set can now be used for several other inventory-centric use cases, such as those listed in Table 2.
| Use Case | Description | Desired Outcomes |
| Stock Level Optimization | Monitor and adjust stock levels based on demand | Reduced stockouts, lower holding costs, increased sales, better demand fulfillment, improved cash flow |
| Reorder Point Prediction | Predict the best time to reorder inventory | Reduced stockouts, optimized order quantities, lower holding costs, improved supplier relationships, enhanced service levels |
| Supplier Performance Analysis | Evaluate supplier delivery and quality | Improved supplier relationships, reduced lead times, better quality control, optimized supply chain, reduced costs |
| Product Shelf Life Optimization | Manage perishable goods effectively | Reduced waste, improved profitability, optimized inventory turnover, better customer satisfaction, reduced costs |
| Inventory Turnover Analysis | Analyze the rate at which inventory is sold and replaced | Improved cash flow, optimized stock levels, better demand forecasting, increased profitability, reduced holding costs |
| Demand Forecasting | Predict future demand for products | Optimized inventory levels, reduced stockouts, increased sales, improved customer satisfaction, reduced holding costs |
| Overstock Identification | Identify products with excess stock | Reduced holding costs, improved cash flow, better promotional planning, reduced waste, optimized product placement |
| Automated Replenishment | Automate the inventory ordering process | Reduced human errors, improved efficiency, optimized stock levels, reduced lead times, increased profitability |
| Inventory Ageing Analysis | Track inventory that has been in stock for too long | Reduced waste, improved profitability, optimized inventory turnover, better resource allocation, reduced holding costs |
| Store Allocation Optimization | Allocate products to stores based on demand | Reduced stockouts, increased sales, improved customer satisfaction, better store performance, optimized logistics |
This use case approach helps the organization prioritize and focus its precious data management and governance resources on data sets that are most valuable to the organization’s most important use cases. Subsequent use cases reap the benefits of those data management investments by accelerating use case time-to-value while de-risking each subsequent use case implementation.
Retail Industry Building Block #3: POS + Inventory Use Cases
Courtesy of the data management focus forced by these two business initiatives, we now have high-quality POS and inventory data available to the retailer. What use cases can leverage combining or blending these two data sources at zero marginal cost? Table 3 shows potential use cases that can be optimized by combining POS and inventory data.
| Use Case | Description | Desired Outcomes |
| Demand-Supply Alignment | Align inventory levels with customer demand patterns | Reduced stockouts, optimized inventory, increased sales, improved customer satisfaction, reduced waste |
| Dynamic Pricing | Adjust prices based on inventory levels and sales trends | Increased profitability, reduced excess stock, optimized sales, improved customer satisfaction, better price competitiveness |
| Customer-Driven Inventory Optimization | Adjust inventory based on customer purchase history | Improved product availability, reduced stockouts, increased sales, enhanced customer satisfaction, optimized product mix |
| Personalized Product Recommendations | Suggest products based on purchase history and stock levels | Increased sales, improved customer experience, better cross-selling, optimized inventory turnover, higher conversion rates |
| Real-Time Inventory Visibility for Customers | Provide customers with real-time stock availability information | Increased sales, reduced cart abandonment, improved customer satisfaction, optimized order fulfillment, reduced returns |
| Promotion Inventory Planning | Plan promotions based on inventory levels and customer preferences | Reduced excess stock, increased promotional effectiveness, better demand fulfillment, improved sales, optimized promotional spend |
| Out-of-Stock Notification System | Notify customers when out-of-stock items are available again | Improved customer satisfaction, reduced lost sales, better customer engagement, increased sales, enhanced customer loyalty |
| Store-Specific Inventory Planning | Customize inventory for individual stores based on local demand | Improved store performance, reduced stockouts, increased sales, better customer satisfaction, optimized logistics |
| Seasonal Inventory Planning | Align seasonal product availability with customer demand | Optimized inventory, reduced stockouts, increased sales, improved customer satisfaction, reduced holding costs |
| Personalized In-Store Promotions | Offer store-specific promotions based on customer preferences and stock levels | Increased in-store traffic, improved customer engagement, optimized inventory turnover, enhanced sales, higher customer loyalty |
I can amplify the data economic multiplier effect by blending these high-quality data sets, which are already stored in my data lake or data lakehouse and where we have invested the required data management and governance resources. This allows me to tackle more advanced use cases, again, at near-zero marginal cost (Figure 2).
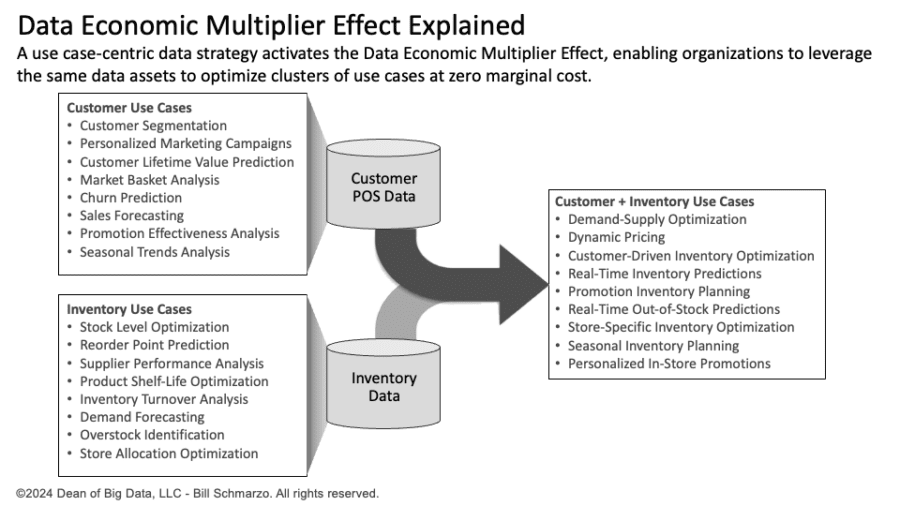
Figure 2: Data Economic Multiplier Effect in Action for the Retail Industry
Data Economic Multiplier Effect Explained Summary
“How effective is your organization at leveraging data and analytics to power your business models?”
This blog outlined the game-changing nature of the Data Economic Multiplier Effect concept. It explained that, unlike traditional assets, data never depletes and can be reused across multiple use cases at zero marginal cost. Drawing from economic principles, the blog described how data can create compounded value through different business use cases, shifting the focus from traditional financial accounting (which follows a “value in exchange” approach) to an economic framework emphasizing “value in use.”
We used a retail industry example to show how prioritizing and focusing your data management and data governance resources on the POS and inventory datasets can power a growing number of business-critical use cases, such as understanding customer purchasing behavior, optimizing inventory levels, and acting more quickly on market trends. By combining these data source building blocks, retailers can unlock more advanced use cases, such as predictive analytics for demand forecasting, personalized marketing strategies, and real-time inventory management (Figure 3).
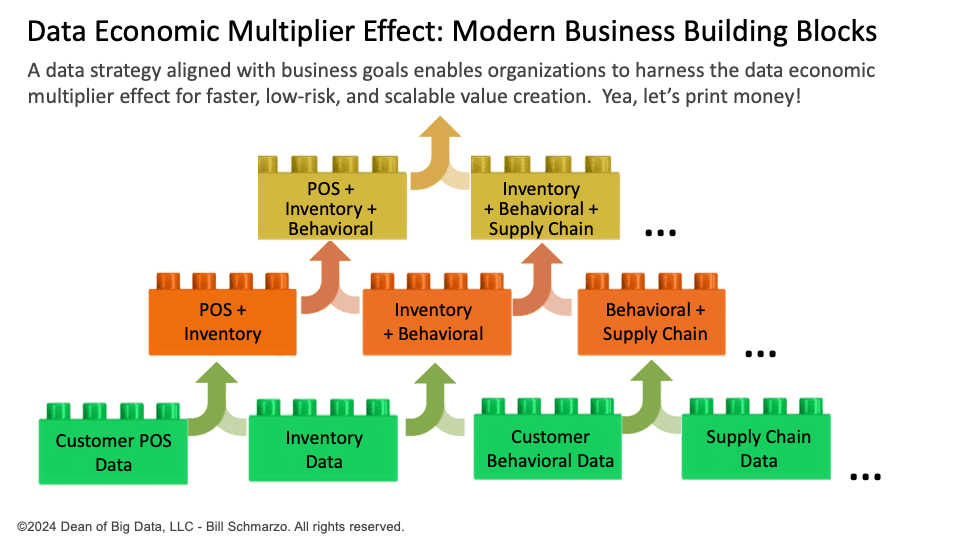
Figure 3: Modern Business Building Blocks
Extra Credit Homework
Try this exercise for your industry for extra credit and that all-important gold star. Below is the ChatGPT prompt (use the “Dean of Big Data GPT” if you have access to ChatGPT4…”Don’t cost nothin’”):
ChatGPT Prompt: First, identify the two most important data sets for a [retailer]. Then, create a table for each data source that lists the use cases with a one-sentence description of that use case in the first column. In the second column, list a one-sentence description of that use case. In the third column, list 5 to 6 desired outcomes for each use case, and then, in the fourth column, assess each use case’s business value on a scale of 1 to 100, where 100 is extremely valuable. Then, build a corresponding table for the use cases supported when you integrate or blend both data sources. List 8 to 10 use cases per data source.
[1] Adam Smith, “Wealth of Nations,” Book I, Chapter IV: Of the Origin and Use of Money, 1776
[2] The Economic Multiplier Effect is when an initial investment generates additional economic activity, resulting in a total impact greater than the initial expenditure due to successive rounds of re-spending within the economy.