Data-driven Marketing Strategy: Spatial Analytics for Micro-marketing
 Organizations, often in their me-too hurry to adopt a new technology, just pour their old-wine (data) into a new bottle. What was originally called ‘sales-information-system’ in the good-old-days underwent many avatars before it became BI (business intelligence) and then off-late, it is time to switch again. The latest avatar is called Data-Visualization-Tool, and every CIO worth his name has a budget. Data-visualization Tools, undoubtedly offer a much better interface for Sales and Marketing Teams to analyze data in their quest to do better, besides serving as a platform for “Self-service Analytics”.
The purpose of this article is not to list ten-best data-visualization tools, or how wonderful they are in transforming the way the marketing-manager devises his strategy. This is about the data that resides inside the visualization tool that ultimately-should provide actionable insights.
The data that you need vs. The data that you have
The spoiler, as usual, is “the data” or the lack of it!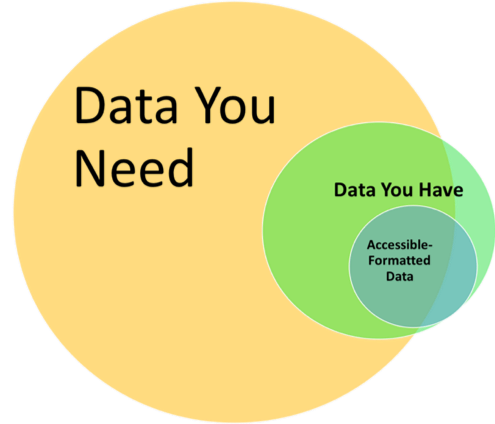
Typical Sales-Information-System has limited-value as it (essentially) slices-and-dices the same internal Sales data…. Last Year Vs. Current Year or drill-down by Product-Geography to the extent transactional data exists. Almost all of it a post-facto-analysis, often used for forecasting based on historical data.
A typical Marketing-Sales manager uses the Sales-information-system for his reporting requirements, usually when he needs to submit his monthly report or when he must make a power-point for someone, but rarely-ever as a tool to draw much needed insights for devising his market strategy. For example: evaluation of a Dealer’s performance or a field-sales-executive’s performance gets done purely based on an internal target vs actual, never on actual-opportunity-size vs performance. Critical information like top-10 micro-markets by each state where majority of ad-spend should be focused, or where exactly the market-size justifies recruitment of more dealers or expansion of field-sales-force etc. are all decisions based on collective-gut.
The reasons are not difficult to see…
The critical information needed for devising a market-strategy is the data available elsewhere, outside of the organization’s ERP. Namely – the market-opportunity-size by product & the ever-changing customer’s preferences by each micro-market, in each town and village, every year.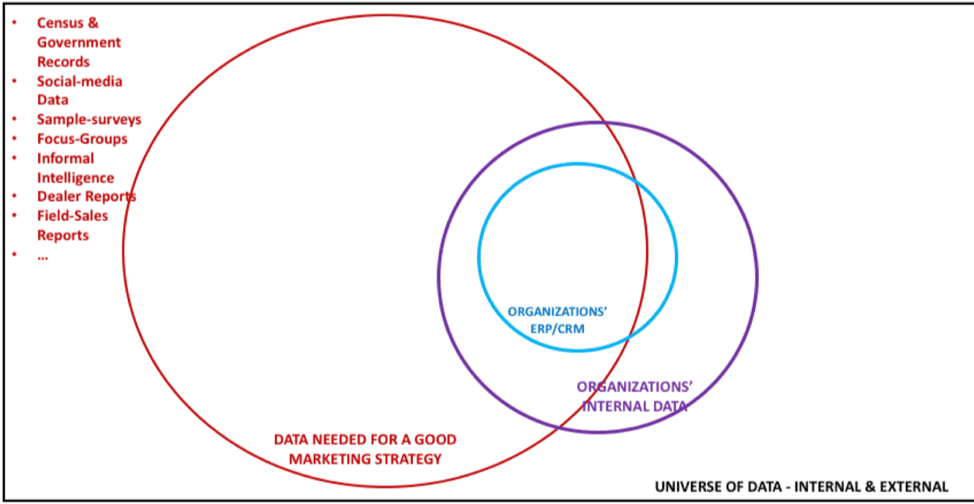
Customers ‘profile, their preferences, local factors etc. are very different in different micro-markets (small towns & villages) and hence determine the market-size for a specific product or the relative market-share of each brand, in each of the micro-markets. The Marketing strategy (product-promotion-pricing etc.) needs to be customized for each micro-market.
The source of all data: The field sales executive
A company’s performance is usually just as good as its Field-Sales-Force. Often a low-paid, name-less face-less guy who operates out of remote areas, never-seen at Regional Head Quarters except once-a-year during the Budgeting season.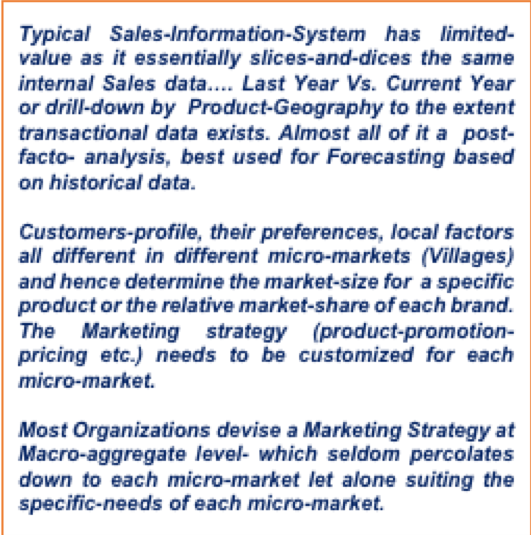
The Field-Sales Executive is supposed to have his ear to the ground, know the-local-markets well, visit the key end-customers and meet the Dealers regularly.
Field-Sales-Executive is at the bottom-of-the-pyramid, where the rubber-meets-the-road… hence his mobile is tracked, he is asked to file Status-Reports monthly, weekly and in a few cases daily, …in essence- a “source” for ground-level information.
In our experience, we have not seen any “sales information reports” being generated specifically to enable a Field-Sales-Executive to do a better job. We have not seen too many companies talking about enabling the field-sales force with useful information- actually help him maximize sales, productively use his time.
The sales information system – whatever may be the mode or the nomenclature, is almost-always made for the higher-management to review the performance of sales executives, and in most cases even the basic-transaction-level drill-down itself is never there, let alone drill-down view of market intelligence by each village.
Marketing Strategy: The Anatomy of Hitherto Unresolved Problems
Most Organizations devise a marketing strategy at a macro-aggregate level- which seldom percolates down customized for the specific-needs of each micro-market. Geography-specific investments are rarely rational-data-driven decisions.
Many organizations struggle to answer questions such as where to locate-recruit Dealers, where to locate warehouses, Ad-spend, Village-level territory-panning etc. Metrics-collection & Reporting is almost-always bottom-up; The field-sales-executive or the Dealer (where rubber-meets-the-road) is the chief source of market-intelligence – which gets collated and supplied on a dash-board to the CxOs.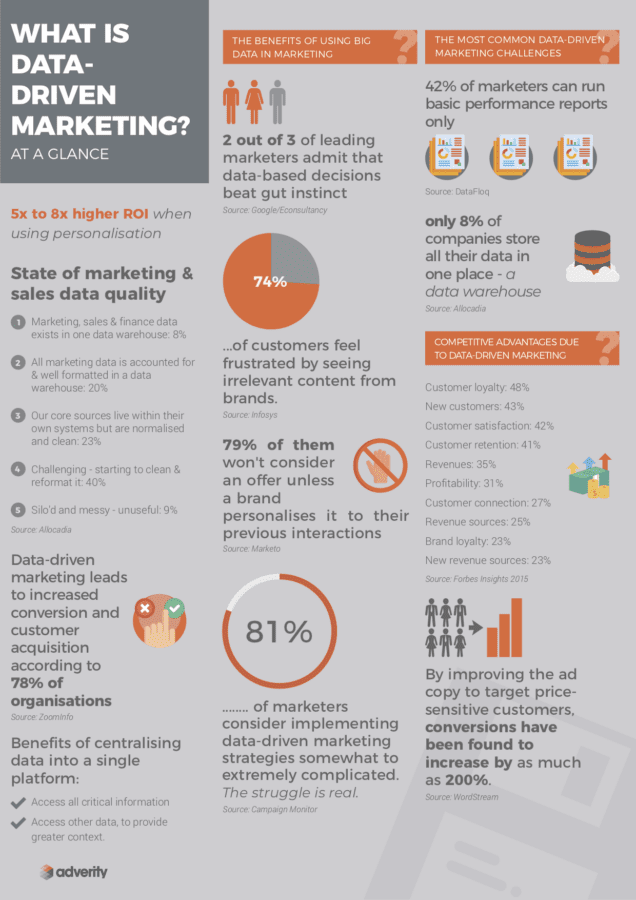
As explained earlier in this article, the typical Sales-Information-System has limited-value as it essentially slices-and-dices the same internal sales data…. Last-year vs. Current-year or drill-down by Product-geography to the extent transactional-data exists. Almost-all-of-it tends to be post-facto- analysis, best used for forecasting based on historical data, or sometimes for root-cause analysis; there is little that enables a field-sales-executive by providing actionable insights that help him to do a better job.
Operating Blind:
In good many organizations, there is a lag between the date of transaction, and the date by which it gets reflected into the ‘central IT system, or the ERP of the company. The lag could be anywhere between a few days to few months. The reasons?
- Could be anything from using of a separate disconnected PoS application where the actual invoicing happens to pure indiscipline.
- The tell-tale signs of all-is-not-well with the IT systems are visible when the company takes enormously long-time to declare the audited-financials every quarter.
- Multiple-disconnected applications mean multiple hand-offs in the information chain, and more disturbingly multiple-data-standards which make the tasks like the corporate-consolidation of financials every quarter a nightmarishly difficult exercise.
- The tell-tale signs include hundreds of excel-sheets of floating around and sales & finance teams burning mid-night-oil each time the top management asks for a slightly different report.
The Marketing Manager may fail to find the right expression, but instinctively knows what he wants. He prefers the field-sales force to spend more time ‘actually’ selling on the ground, rather than sit in the branch-office filing reports. He prefers the IT Department to be the source of information-on-demand for all reports and he knows “right information- a.k.a. actionable-insights” delivered on-demand can help the field-sales force improve their performance by leaps.
However, more often than not, the marketing-manager operates at the mercy of the CIO. Being not sufficiently tech-savvy, he blindly accepts what-ever system that CIOs push as the latest miraculous cure.
Marketing Managers eternally hope for “the solution” that finally provides them the actionable insights that allow them to spend more time ‘actually selling’ rather than ‘hunting for data’.
CIOs on the other hand complain on how the systems are perfect, but the so-called marketing-managers are like cave-dwellers, painfully slow to adopt and use such wonderful systems.
The truth perhaps lies in between.
And the Blind leading the Blind:
In our experience, Marketing Managers deeply distrust the data provided by the internal IT departments. often one finds them developing a parallel information-system on excel-sheets with data painstakingly collected from sales-team or from dealers.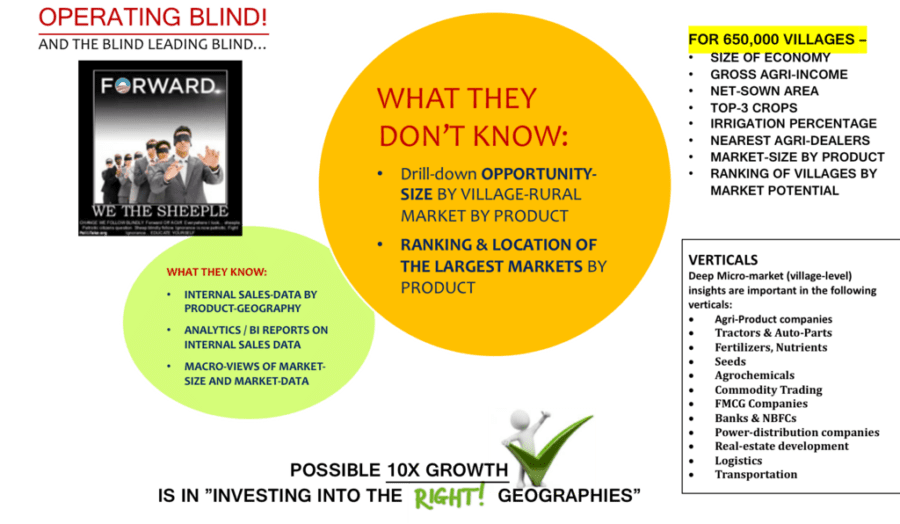
The reasons once again, are not difficult to see…
The critical information needed for devising a market-strategy is the data available elsewhere, outside of the organization’s ERP and CRM; namely – the market-opportunity-size by product-geography & the ever-changing customer’s preferences by each micro-market, in each town and village, every year.
Other-than a half-hearted attempt at collating the social-media data, we have not seen any CIO attempting to actually try and collate the market-opportunity-size by product for each of the geographies or for each of the micro-markets. Micro-marketing as a concept – is still in nascent stages of development, and I have not seen any software remotely related to micro-marketing in Gartner’s hype cycle… not as yet.
There is absolutely no doubt any organization which implements spatial-analytics & micro-marketing solutions will develop a tremendous competitive-advantage.
The cure for Operating Blind: Micro-marketing & Spatial analytics
I have personally used Infruid’s Vizard as the Software of choice for the first implementation of Spatial Analytics solution development that I was involved with. But you may imagine a typical Data-Visualization tool like Tableau or QlikView or whatever other tool you may be familiar with that comes preloaded with the complete market-data for each of the 650,000 villages in India for each of the products that your customers mass-distribute across India. Then all you have to do is upload your historical product-specific sales data into the Visualization tool. And viola, you have micro-market insights that you have only dreamed of, but never seen before. More details below:
For example, our Pathfinder solution comes preloaded with market-data for each of the 650,000 villages in India.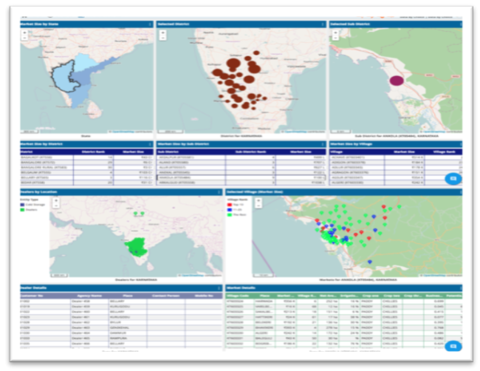
- Complete Socio-Economic data for each Village, Town and City – including Population & Gender
- Total Income levels & Agri-Income
- Net-sown Area & Irrigation percentage
- Top-3 Crops & Average yield per acre
- Economy Size & Income Levels
- No & Locations of Agri-market yards, Cold-storages etc.
- Roads & Accessibility for each Village, Town
- Rural Market Potential Index
- Accessibility Index.
Custom-content to be loaded
- Location & Vital Stats for Existing Dealers
- Location & Vital Stats for New Dealers
- Historical Sales by product by District/Town/Village
- Actual Business by product, Geography through Time
- Location & Coverage of Assigned Territories by each Field-Sales-Executive.
What we estimate through a custom-algorithm
- Market-Potential for different categories of products for each of the 650,000 villages
- Top-10 villages for each product in each sub-district, and in each district
- Identifying the relative-growth of each micro-market.
- Identifying under-served markets
- Distance of each micro-market from the nearest dealer.
Benefits: Deep insights & Data-driven Decisions
Deep drill-down village-level market intelligence & Precision analytics enabling decisions such as –
- Locate your new dealers, retailers or show-rooms closer to your largest markets
- Locate your Sales-executives closer to largest / under-served markets.
- Locating your new manufacturing plants, and new ware-houses.
- Territory planning
- Sales Performance measurement based on actual-service-levels in each markets & Opportunity fulfilment.
Please do write to me at – [email protected] if you are interested in knowing more.
*The infographic above has been sourced from Adverity – The Austrian Data Analytics company.
