 “I love it when a plan comes together” – John (Hannibal) Smith, The A Team
One of the biggest challenges that I continue to see are organizations struggling to cross the Analytics Chasm; to transition their use of data and analytics from retrospective Business Intelligence that monitors what has happened to AI/ML-driven analytics that predict what is likely to happen and prescribe preventative, corrective or monetization actions.
I wrote about the challenges to crossing the Analytics Chasm in the blog “Crossing the Big Data / Data Science Analytics Chasm” and in further detail in my just released book “The Economics of Data, Analytics, and Digital Transformation”. The Analytics Chasm prevents organizations from leveraging AI / ML analytics to uncover the customer, product, and operational insights (propensities) buried in the data, that then can be used to optimize the organization’s business and operational use cases (see Figure 1).
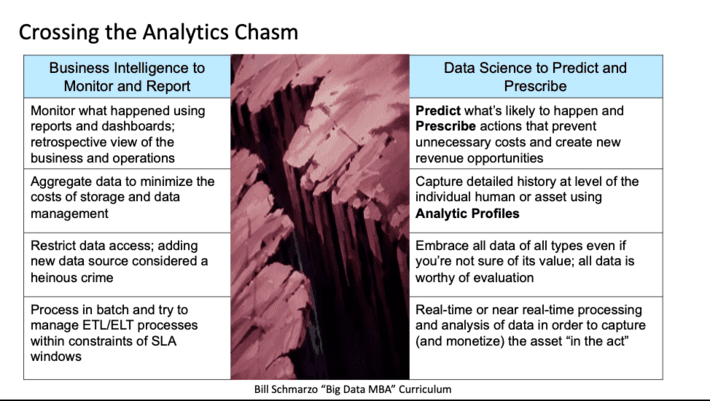
Figure 1: Crossing the Analytics Chasm Challenge
Then on my early morning jog, it became clear to me what organizations specifically need to do to cross the analytics chasm. And the key to successfully crossing the analytics chasm is found in my favorite and maybe my most powerful concept – the Big Data Business Model Maturity Index (see Figure 2).
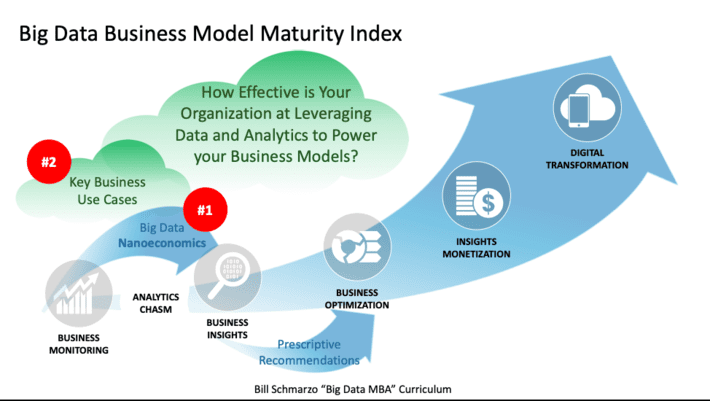
Figure 2: Big Data Business Model Maturity Index
The Big Data Business Model Maturity Index highlights what organizations specifically need to do to cross the analytics chasm (highlighted by the red circled numbers in Figure 2):
- Exploit “Nanoeconomics” – which is the economic theory of individual human and device propensities – to identify (uncover) and codify the customer, product and operational insights (predicted propensities) at the level of the individual human and/or device that enables the optimization of the organization’s key business and operational use cases.
- Embrace a use-case-by-use-case, ROI-driven approach (versus the traditional IT “Big Bang” technology approach) of applying and re-using the customer, product, and operational insights to cross the analytics chasm.
But first, to cross the analytics chasm, executive management must commit to changing how the run the business, by transitioning from running the business based on averages (using Business Intelligence reports and dashboards) to running the business based on predicted customer, product, and operational propensities (codified using AI / ML and Data Science).
Let’s explore this executive management challenge further…
Management Mindset: Transitioning from Averages to Propensities
One of the biggest organizational challenges to crossing the Analytics Chasm is transitioning executive management from running the business by making decisions based upon averages (average attrition rate, average cross-sell rate, average inventory turns, average operational downtime, average COVID infections) to running the business by making decisions based upon individual entity (humans or devices) predicted propensities.
Now there is nothing wrong with Business Intelligence. Business Intelligence provides the necessary transparency around the metrics around which the organization can understand what’s working and what’s not working. But Business Intelligence revolves around the world of averages, and the problem with averages is this:
Making decisions based on averages at best yield average results.
Unfortunately, averages don’t provide the level of granularity necessary to make precision decisions that drive the optimization of the organization’s key business and operational use cases; decisions based upon averages do not enable “do more with less”. “On average” is not how successful companies will survive in a world of continuous transformation.
In fact, making decisions based on averages can drive yield incorrect decisions. See “USF Hackathon: Making a Business Hypothesis Actionable with Prescri…” to learn more about the challenges of making decisions based on averages and Simpson’s Paradox, which is a probability phenomenon in which a trend appears in granular data groups but that trend disappears or even reverses when the groups get aggregated (see Figure 3).
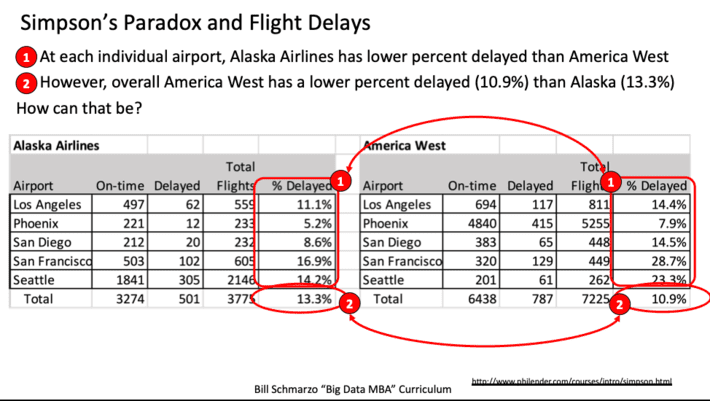
Figure 3: The Challenge of Averages and Simpsons Paradox
So, to successfully cross the analytics chasm, we need to prepare management to move away from overly-generalized operational and policy decisions based on averages, to a mindset of leveraging customer, product, and operational predicted propensities to make high-precision, granular operational and business decisions.
Now let’s dig into the specifics of what organizations need to do to make those high-precision, granular predictive and prescriptive decisions necessary cross the analytics chasm.
(#1) Embrace Nanoeconomics
In the blog “Mastering Nanoeconomics in the Era of Digital Transformation”, I introduced the concept of nanoeconomics. I define nanoeconomics as:
Nanoeconomics is the economic theory of identifying, codifying and optimizing based upon individual human and device propensities, where propensities are the natural inclinations, tendencies, patterns, trends and relationships for humans or devices to behave or operate in a predictable manner.
In that blog, I highlighted the key role that Analytic Profiles play to enable the power of nanoeconomics (see Figure 4).
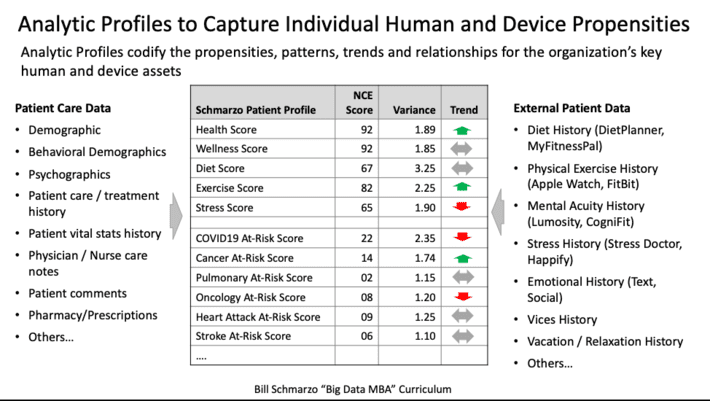
Figure 4: Role of Analytic Profiles in Nanoeconomics
Analytic Profiles provide a model for capturing and codifying the organization’s customer, product, and operational analytic insights (predicted propensities) in a way that facilities the sharing and refinement of those analytic insights across multiple use cases. It is around these Analytic Profiles that organizations will build a significant percentage of their analytics capabilities (e.g., detect anomalies, predict next best action, optimize utilization, load balancing, minimize inventory, rationalize products, predict maintenance needs, flag questionable activities).
(#2) Embrace Use-Case-by-Use-Case Deployment Approach
Surprisingly, many IT executives struggle with accepting that a use-case-by-use-case (incremental) approach is the best way to not only build out an organization’s data monetization and analytics capabilities, but also provides the fastest “bang for the buck” from a ROI perspective. Maybe that’s because many of today’s Chief Information Officers (CIO’s) rose to prominence in the era of Enterprise Resource Planning (ERP) “big bang” projects – projects where the software cost $20M to $50M, between 2x to 4x of that was spent on consulting, and after 5 years (and thousands of life), the CIO hoped that something of value would squirt out at the end (and the business stakeholders were ALWAYS disappointed as the functionality promised was eons away from the functionality delivered).
The use-case-by-use-case deployment approach not only exploits the rapid learning, sharing, and reapplication of the data and analytic learnings to future use cases, but also enables organizations to deliver a compelling Return on Investment (ROI) on each use case as they incrementally build out their data and analytics assets. Yea, it’s like printing money (see Figure 5).
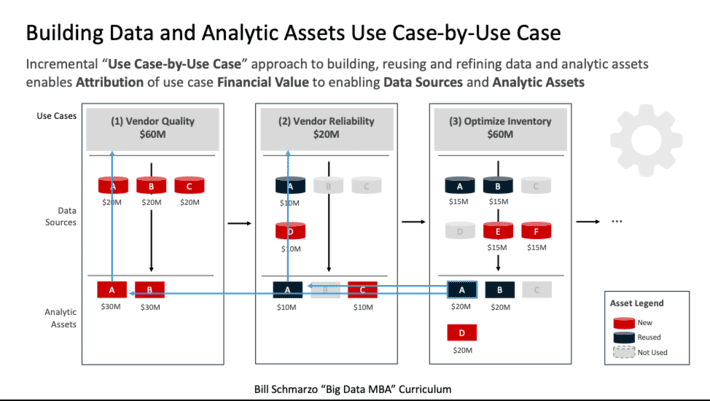
Figure 5: Building Data and Analytic Assets Use Case-by-Use Case
In the era of digital assets, the classic ERP “Big Bang” approach to deploying technology is dead. Instead, organizations are embracing the “economies of learning” by applying a use-case-by-use-case approach that enables data and analytic developments and improvements from one use case to be reapplied to future use cases while driving a positive ROI from each use case (which the business users love!).
Summary: Crossing the Analytics Chasm
While I don’t want to scare executive management, they need to understand that crossing the analytics chasm is not a technology challenge, but more of an executive management challenge in changing the mindset of how senior management uses the economics of data and analytics to run the business.
Unfortunately, to quote my friend Gordon MacMaster, “Areas of an organization will fight the crossing the analytics chasm to the death because it will be seen as a direct threat to how they run their businesses. Others will see the potential value and will latch on, but their “help” will put the effort into an early grave. People are not always rational actors (to put it lightly).”
Navigating across the analytic chasm is beyond the qualifications of a today’s traditional Chief Data Officer – it requires a Chief Data Monetization Officer who has both the responsibility and the governance authority to mandate how the organization leverages the digital data and analytics assets to derive and drive new sources of customer, product, and operational value.
Executive management, with the guidance of a strong, collaborative, and visionary Chief Data Monetization Officer (I think I know where you can find one…), needs to understand that to cross the Analytics Chasm requires an incremental data and analytics development approach that 1) builds Analytic Profiles that capture, reuse and refine the individual human and device propensities with a 2) use case-by-use case deployment approach that leverages the customer, product, and operational insights to optimize the key business use cases.
In knowledge-based industries, the “economies of learning” are more powerful than the “economies of scale.” And soon all industries will be knowledge-based industries.
Homework Exercise: What would you do if you knew…
To understand the potential and power of being able to predict individual human and device propensities, let’s take our business executives through this simple exercise:
- What customer, product and operational insights would you want to know? And then,
- What actions would you take if you knew those customer, product, and operational insights?
Here’s a simple form (see Figure 6) to help capture the brainstorming exercise (so that you can share learnings across the organization).
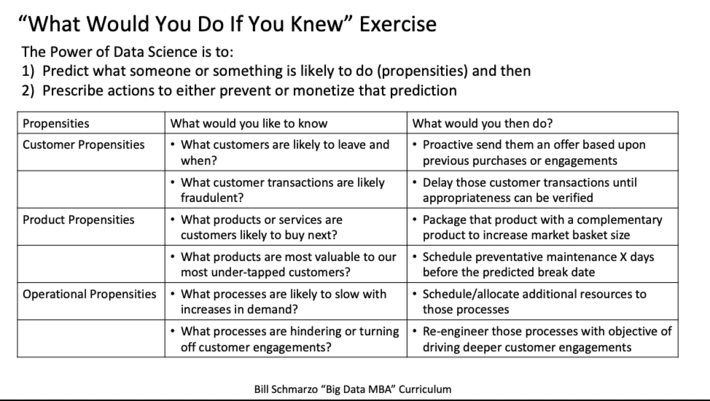
Figure 6: “What Would You Do If You Knew?” Brainstorming Exercise
If you could predict when and why a specific human or device action is likely to happen, imagine how powerful that would be in transforming the very essence of your economic value curve and your organization’s ability to do dramatically more with dramatically less. Hell, it’s almost like magic…and that’s the power of crossing the analytics chasm!
If you get my new book “The Economics of Data, Analytics, and Digital Transformation,” I’d love your feedback on the following three questions:
- What topics were most relevant to you?
- What topics needed more details?
- What topics did I miss?
Always looking for ways to keep the book relevant. Thanks for your support!
