A popular phrase tossed around when we talk about statistical data is “there is correlation between variables”. However, many people wrongly consider this to be the equivalent of “there is causation between variables”. It’s important to explain the distinction: Correlation means that once we know how one variable changes we can make reasonable deductions about how other variables change There are several variants of correlation:
1. Positive correlation
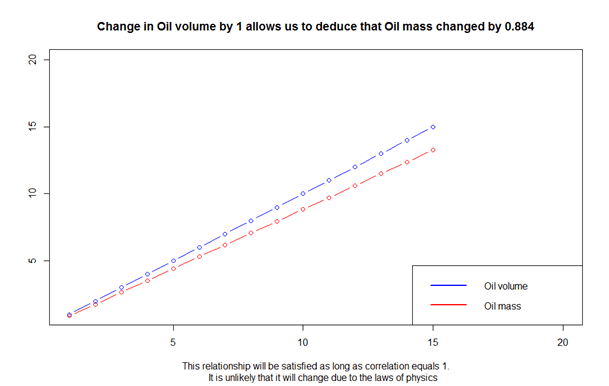
Positive correlation means that with an increase/decrease of one variable, the other variable will rise/fall. A good analogy would be the number of stories in an apartment building and the number of apartments. Logically, a higher building will probably contain more apartments. Full correlation is equal to 1 and means that we can use data to explicitly model changes in values of one variable when we know how others change. In practice this rarely happens, or it describes situations which are obvious and not useful. For example, an increase in Oil volume has perfect correlation with Oil mass. 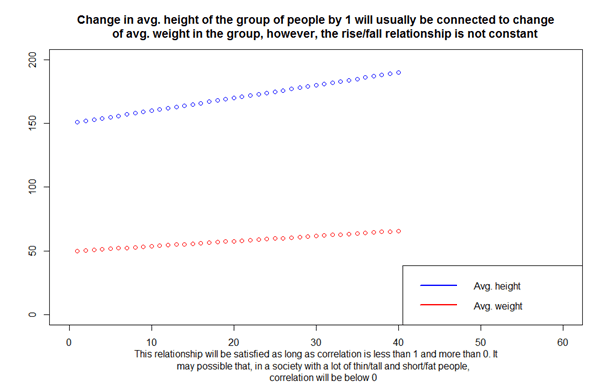
2. Zero correlation
Correlation that equals 0 means there is no way to deduce behavior of one variable based on another variable’s behavior.
3. Negative correlation
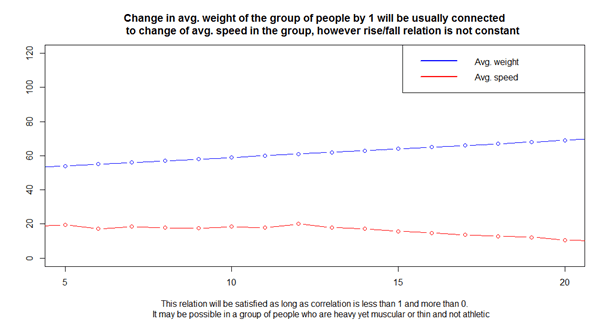
Negative correlation means that with the rise/fall of one variable, we can expect a decrease/increase of the other variable. Negative correlation that is above -1 means only a partial possibility of deduction. For example, if a person’s weight and running speed are negatively correlated, a heavier person can’t usually run as fast as a lighter person – but it’s not always the case. Full negative correlation equals -1 and means that we can perfectly deduce the fall/rise of one variable knowing the rise/fall of the other. In practice it rarely happens or is obvious and, therefore, not useful.
What does correlation mean?
Many people consider correlation as sure proof of causality between variables. That’s not true – correlation can be explained by 5 possibilities:
- Variable A influences Variable B – for example the combined salary in a household and the number of cars
- Variable B influences Variable A – as in the above example
- Variable A influences Variable B and Variable B influences Variable A – education level influences the wealth of a person and their wealth influences the education levels they can achieve.
- There exists an unknown variable C, which is correlated and influences both A and B – both the number of cars and the market price of the house in a household are influenced by the salaries.
- Correlation is a random accident.
It may seem that the last point is somehow lazy, but because of the sheer number of data available and the rules of probability, we can find large numbers of correlated variables that in practice are not connected at all.
Examples?
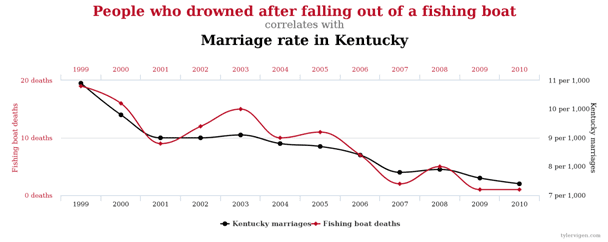
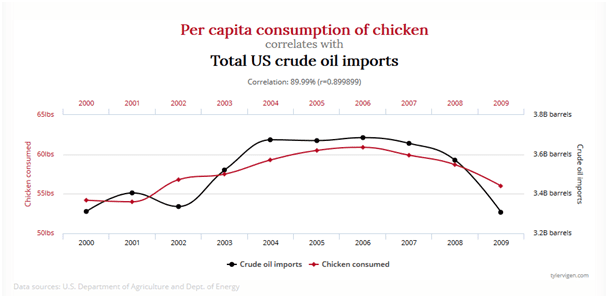
The webpage http://www.tylervigen.com/spurious-correlations offers a great selection of these types of combinations. Enjoy. 🙂
