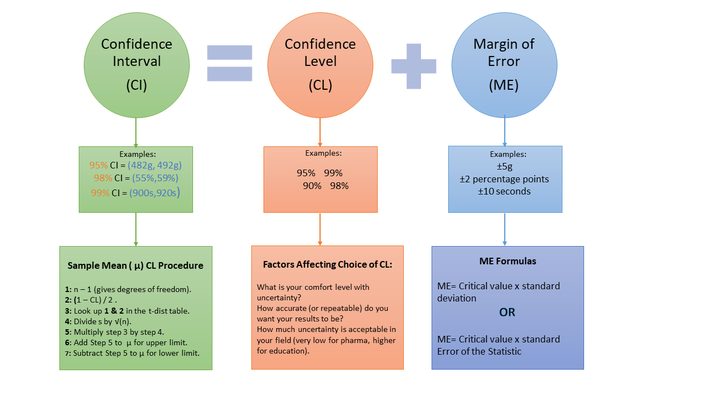
Confidence intervals (CIs) tell you how much uncertainty a statistic has. The intervals are connected to confidence levels and the two terms are easily confused, especially if you’re new to statistics. Confidence Intervals in One Picture is an intro to CIs, and explains how each part interacts with margins of error and where the different components come from.

Click on the picture to zoom in. For more information on CIs and how to find them for means, proportions, and more, see:
Other statistical concepts explained in one picture can be found here.
