This article was written by Jim Frost.
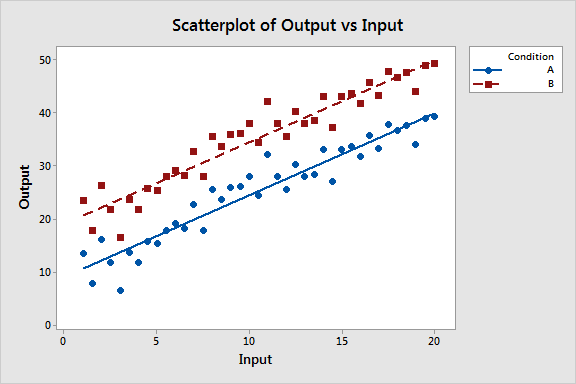
How do you compare regression lines statistically? Imagine you are studying the relationship between height and weight and want to determine whether this relationship differs between basketball players and non-basketball players. You can graph the two regression lines to see if they look different. However, you should perform hypothesis tests to determine whether the visible differences are statistically significant. In this blog post, I show you how to determine whether the differences between coefficients and constants in different regression models are statistically significant.
Suppose we estimate the relationship between X and Y under two different conditions, processes, contexts, or other qualitative change. We want to determine whether the difference affects the relationship between X and Y. Fortunately, these statistical tests are easy to perform.
For the regression examples in this post, I use an input variable and an output variable for a fictional process. Our goal is to determine whether the relationship between these two variables changes between two conditions. First, I’ll show you how to determine whether the constants are different. Then, we’ll assess whether the coefficients are different.
Content of this article:
- Hypothesis Tests for Comparing Regression Constants
- Interpreting the results
- Hypothesis Tests for Comparing Regression Coefficients
- Interpreting the results
To read he whole article, with illustrations and equations, click here.

