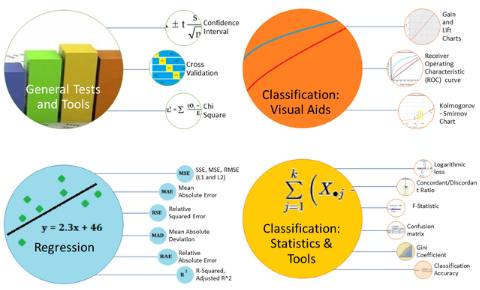
In my previous posts, I compared model evaluation techniques using Statistical Tools & Tests and commonly used Classification and Clustering evaluation techniques
In this post, I’ll take a look at how you can compare regression models. Comparing regression models is perhaps one of the trickiest tasks to complete in the “comparing models” arena; The reason is that there are literally dozens of statistics you can calculate to compare regression models, including:
1. Error measures in the estimation period (in-sample testing) or validation period (out-of-sample testing):
- Mean Absolute Error (MAE),
- Mean Absolute Percentage Error (MAPE),
- Mean Error,
- Root Mean Squared Error (RMSE),
2. Tests on Residuals and Goodness-of-Fit:
- Plots: actual vs. predicted value; cross correlation; residual autocorrelation; residuals vs. time/predicted values,
- Changes in mean or variance,
- Tests: normally distributed errors; excessive runs (e.g. of positives or negatives); outliers/extreme values/ influential observations.
This list isn’t exhaustive–there are many other tools, tests and plots at your disposal. Rather than discuss the statistics in detail, I chose to focus this post on comparing a few of the most popular regression model evaluation techniques and discuss when you might want to use them (or when you might not want to). The techniques listed below tend to be on the “easier to use and understand” end of the spectrum, so if you’re new to model comparison it’s a good place to start.

The above picture (comparing models) was originally posted here.
Read full article here.
