This post was written by Sean Owen.
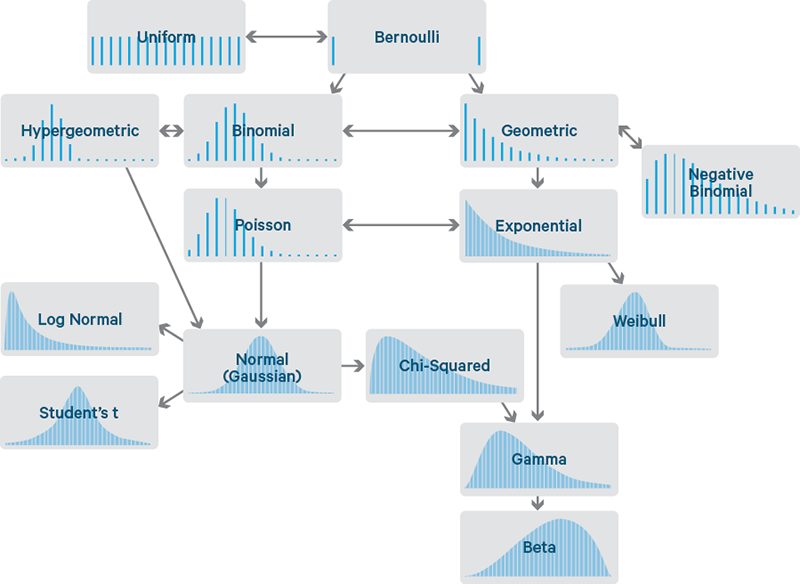
Data scientists have hundreds of probability distributions from which to choose. Where to start?
Data science, whatever it may be, remains a big deal. “A data scientist is better at statistics than any software engineer,” you may overhear a pundit say, at your local tech get-togethers and hackathons. The applied mathematicians have their revenge, because statistics hasn’t been this talked-about since the roaring 20s. They have their own legitimizing Venn diagram of which people don’t make fun. Suddenly it’s you, the engineer, left out of the chat about confidence intervalsinstead of tutting at the analysts who have never heard of the Apache Bikeshed project for distributed comment formatting. To fit in, to be the life and soul of that party again, you need a crash course in stats. Not enough to get it right, but enough to sound like you could, by making basic observations.
Probability distributions are fundamental to statistics, just like data structures are to computer science. They’re the place to start studying if you mean to talk like a data scientist. You can sometimes get away with simple analysis using R or scikit-learn without quite understanding distributions, just like you can manage a Java program without understanding hash functions. But it would soon end in tears, bugs, bogus results, or worse: sighs and eye-rolling from stats majors.
There are hundreds of probability distributions, some sounding like monsters from medieval legend like theMuth or Lomax. Only about 15 distributions turn up consistently in practice though. What are they, and what clever insights about each of them should you memorize?
To read the full article, click here.
- Article: Difference between Machine Learning, Data Science, AI, Deep Learnin…
- Article: What is Data Science? 24 Fundamental Articles Answering This Question
- Article: Hitchhiker’s Guide to Data Science, Machine Learning, R, Python
- Tutorial: Data Science Cheat Sheet
- Tutorial: How to Become a Data Scientist – On Your Own
- Categories: Data Science – Machine Learning – AI – IoT – Deep Learning
- Tools: Hadoop – DataViZ – Python – R – SQL – Excel
- Techniques: Clustering – Regression – SVM – Neural Nets – Ensembles – Decision Trees
- Links: Cheat Sheets – Books – Events – Webinars – Tutorials – Training – News – Jobs
- Links: Announcements – Salary Surveys – Data Sets – Certification – RSS Feeds – About Us
- Newsletter: Sign-up – Past Editions – Members-Only Section – Content Search – For Bloggers
- DSC on: Ning – Twitter – LinkedIn – Facebook – GooglePlus

