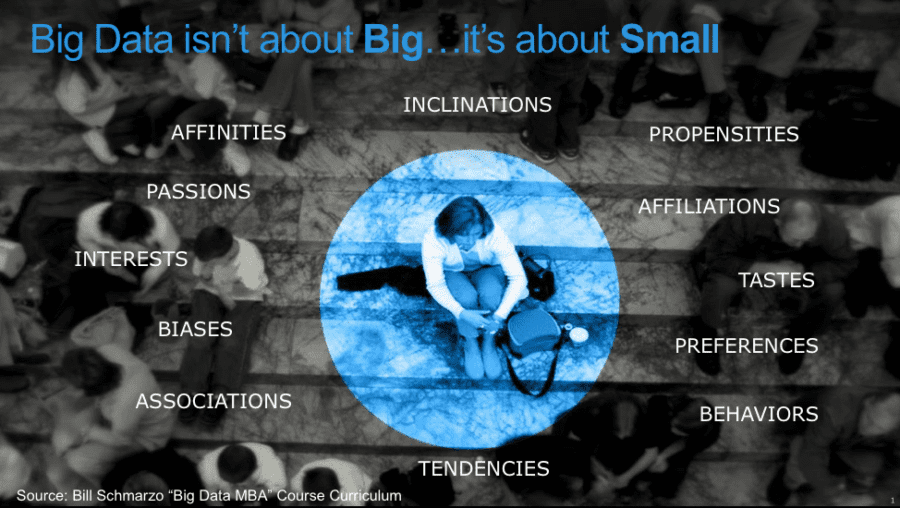
To be actionable, Big Data and Data Science must get down to the level of the individual – whether the individual is a customer, physician, patient, teacher, student, coach, athlete, technician, mechanic or engineer. This is the “Power of One.” By applying data science to the growing wealth of human purchase, interaction and social engagement data, organizations can capture individual’s tendencies, propensities, inclinations, behaviors, patterns, associations, interests, passions, affiliations and relationships that drive business monetization opportunities (see Figure 1).

Figure 1: Using Analytic Profiles to Capture and Monetize the “Power of One”
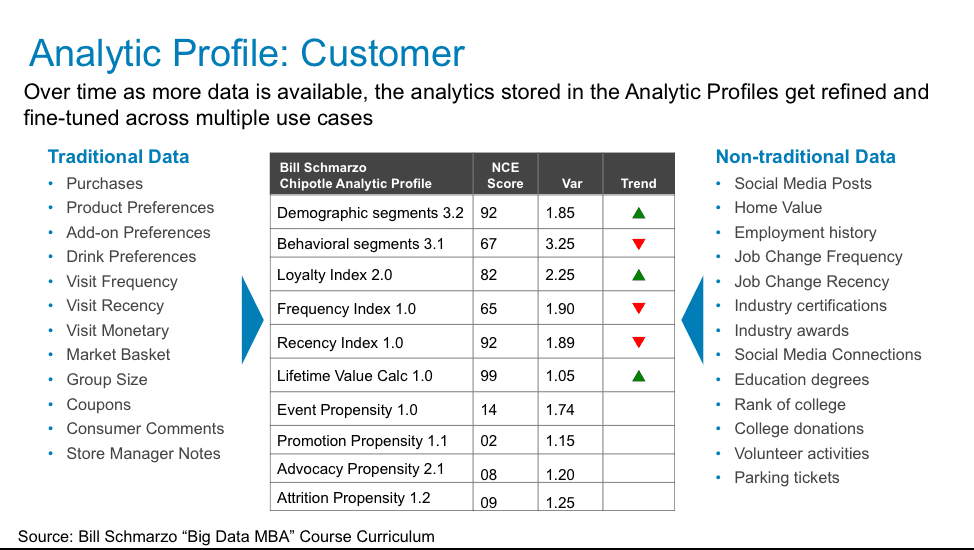
Analytic Profilesprovide a structure for capturing an individual’s behaviors and tendencies in a way that facilities the refinement and sharing of these digital assets across multiple business and operational use cases (see Figure 2).

Figure 2: Analytic Profiles for Capturing and Quantifying Individual Customer’s Behaviors
But it isn’t just humans who develop behavioral tendencies. Cars, cranes, wind turbines, CT scanners, chillers, engines, motors, elevators and other “things” also develop unique tendencies, and that’s the concept behind Digital Twins.
What is a Digital Twin?
A Digital Twin is a digital representation of an industrial asset that enables companies to better understand and predict the performance of things, uncover new revenue opportunities, and optimize the operations of the business. GEpopularized the Digital Twins concept to capture the asset’s detailed history (from design to build to maintenance to retirement/salvage) that can be mined to provide actionable insights into the product’s operations, maintenance and repair.
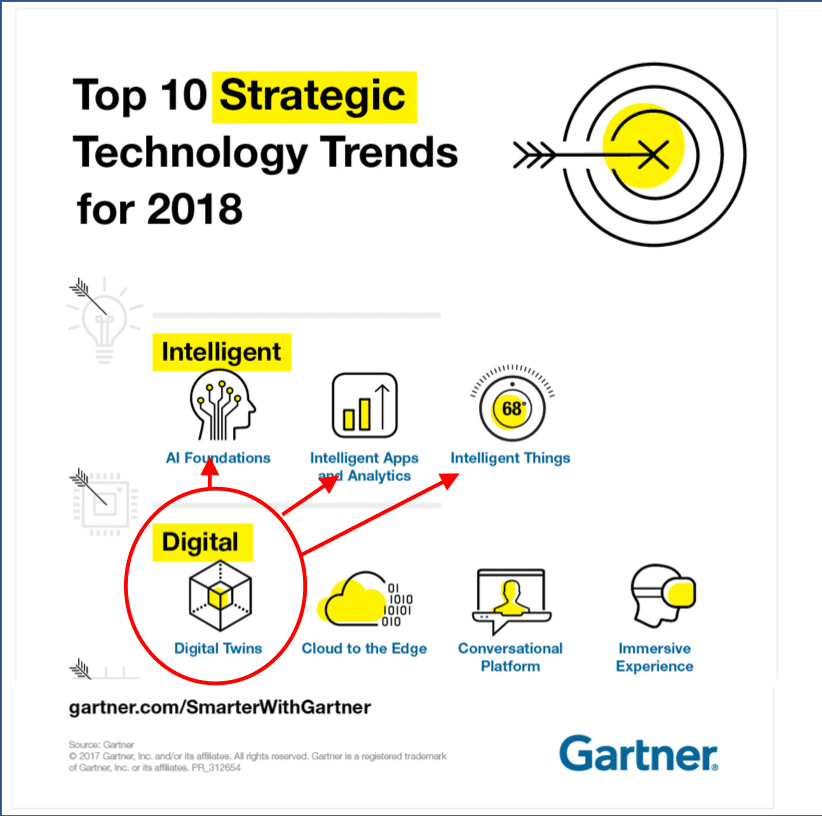
Digital Twins was selected by Gartner (“Top 10 Strategic Technology Trends for 2018”) as one of the top 10 strategic technology trends in 2018. To quote the article:
“Over time, digital representations of virtually every aspect of our world will be connected dynamically with their real-world counterpart and with one another and infused with AI-based capabilities to enable advanced simulation, operation and analysis. City planners, digital marketers, healthcare professionals and industrial planners will all benefit from this long-term shift to the integrated digital twin world.”
Furthermore, Digital Twins provide the foundation for an organization’s artificial intelligence foundation, and the creation of intelligent apps and things (see Figure 3).

Figure 3: Gartner’s Top 10 Strategic Technology Trends in 2018
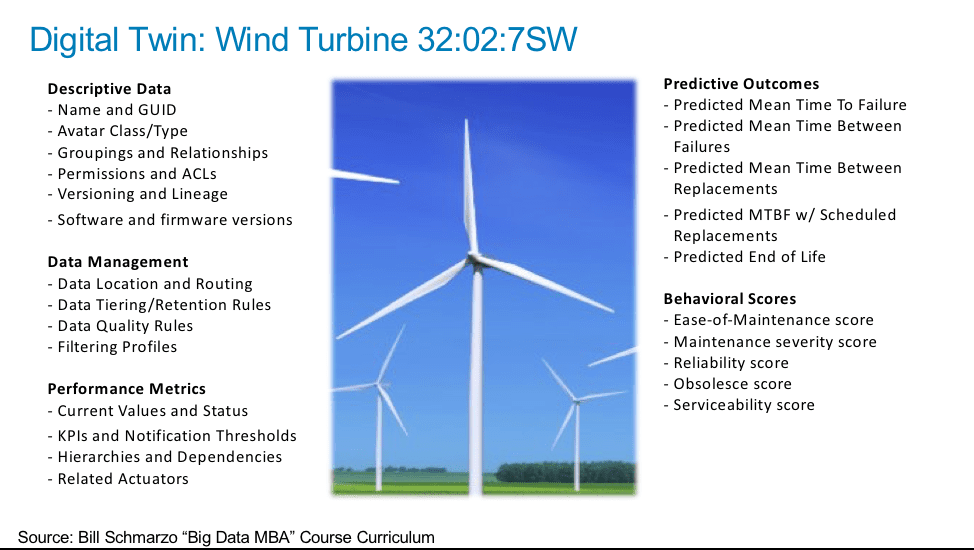
Just like Analytic Profiles are much more than just a “360-degree view of customer” (a meaningless, unactionable phrase that I loathe) with its ability to capture an individual’s propensities, tendencies, inclinations, patterns, relationships and behaviors, the Digital Twin is much more than just demographic and performance data about a device. To fully monetize the Digital Twin concept, one must also capture predictions about likelihood performance and behaviors that can lead to prescriptive actions (see Figure 4).

Figure 4: Digital Twin Captures Historical Performance Metrics And Performance Predictions
One of the key types of analytics that can be performed on “things” is to determine how a particular device performs in comparison to similar devices. This is the heart of Cohorts Analysis.
Role of Cohort Analysis
A cohortis a group of people banded together or treated as a group for a selected period of time (e.g., cohorts in crime).
Cohort Analysisis a subset of human behavioral analytics that takes purchase and engagement data and rather than looking at performance at the aggregate level, it breaks down the performance assessments into related groups of humans. Cohort analysis allows a company to see patterns and trends across the lifecycle of a group of humans. By quantifying those patterns and trends, a company can adapt and tailor its service to meet the unique needs of those specific cohorts.
Cohort Analysis can be combined with clustering, classification and collaborative filtering to predict what products groups of customers might want to buy and what actions they are likely to take.
While cohorts analysis is typically done for groups of clusters of humans, cohorts analysis can also work for clusters of things. Organizations can use cohort analysis to understand the trends and patterns of related or similar devices over time that can be used to optimize their maintenance, repair and upgrade and end of line (EOL) decisions.
Being able to compare or benchmark the performance and operations of one device against a similar group or cluster of similarly-performing devices can be used to deliver operational benefits in the following areas:
- Device performance optimization
- Predictive maintenance
- Repair scheduling optimization
- Inventory and MRO management
- Obsolete and excessive (O&E) inventory reduction
- Supply chain optimization
- Asset utilization
- Network performance optimization
- Load balancing
- Capacity planning
- Product design
- Salvage optimization
- End of Life / Retirement Management
In fact, nearly any analytics that you can perform on humans (with the exception of emotional analysis like sentiment analysis, though I swear there are times when my car *hates* me) can be performed on things.
Summary
Many of the behavioral analytics that we perform on humans can also be performed on things because just as humans exhibit different behavioral tendencies, so do things. And we can use Analytic Profiles (for humans) and Digital Twins (for things) to capture and quantify those behavioral tendencies.
Future blogs will further explore the role of Digital Twins in helping organizations monetize their IOT strategies.
Sources:
“What is Cohort Analysis?”
https://corporatefinanceinstitute.com/resources/knowledge/other/coh…
“Cohort analysis”
https://en.wikipedia.org/wiki/Cohort_analysis
