We recently posted a challenge: creating data videos. You can check the challenge here, including training material and data to produce these videos, with open source software, and in particular with R. Here we provide the solution (including the video) produced by one of the participants. Other solutions from other participants will soon be posted as well. Our full list of challenges of the week can be found here.
The Solution
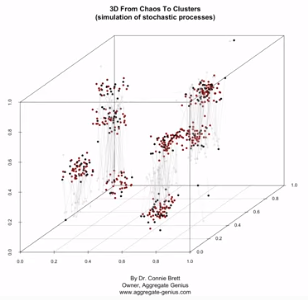
The participant created a 3D version of one of our videos, adding several features along the way. The video features clusters growing, shrinking, merging, or being born, over time, as in a birth-and-death process, or as in the formation of galaxies. You can check the video, explanations, and data here. Below is a screen shot.
Takeaway from this challenge, according to the author:
- The number of clusters steadily decreases
(7 at 20s [~167 iterations], 6 at 40s [~333 iterations], 5 at the end [500 iterations]) - Around the middle of the video you see that the clusters appear to be fairly stable, however more iterations result in a significant change in cluster location and number. A local minimum was detected, however it was not the global minimum.
- One cluster is especially small (and potentially suspect) at the end of the iterations in this simulation
- One of the clusters is unstable: points are exchanging between it and a nearby cluster – further iterations may reduce the number of clusters through consolidation.
- There is a lot more movement of points within the z dimension than along x or y. This would be worth investigating as a potential issue with the clustering algorithm or visualization – or perhaps something interesting is going on!
- There appear to be several outlier points that stick around toward last 1/3 of the video and move around outside of any cluster. These points are likely worth investigating further to understand the source and behavior.
DSC Resources
- Career: Training | Books | Cheat Sheet | Apprenticeship | Certification | Salary Surveys | Jobs
- Knowledge: Research | Competitions | Webinars | Our Book | Members Only | Search DSC
- Buzz: Business News | Announcements | Events | RSS Feeds
- Misc: Top Links | Code Snippets | External Resources | Best Blogs | Subscribe | For Bloggers
Additional Reading
- What statisticians think about data scientists
- Data Science Compared to 16 Analytic Disciplines
- 10 types of data scientists
- 91 job interview questions for data scientists
- 50 Questions to Test True Data Science Knowledge
- 24 Uses of Statistical Modeling
- 21 data science systems used by Amazon to operate its business
- Top 20 Big Data Experts to Follow (Includes Scoring Algorithm)
- 5 Data Science Leaders Share their Predictions for 2016 and Beyond
- 50 Articles about Hadoop and Related Topics
- 10 Modern Statistical Concepts Discovered by Data Scientists
- Top data science keywords on DSC
- 4 easy steps to becoming a data scientist
- 22 tips for better data science
- How to detect spurious correlations, and how to find the real ones
- 17 short tutorials all data scientists should read (and practice)
- High versus low-level data science
Follow us on Twitter: @DataScienceCtrl | @AnalyticBridge

