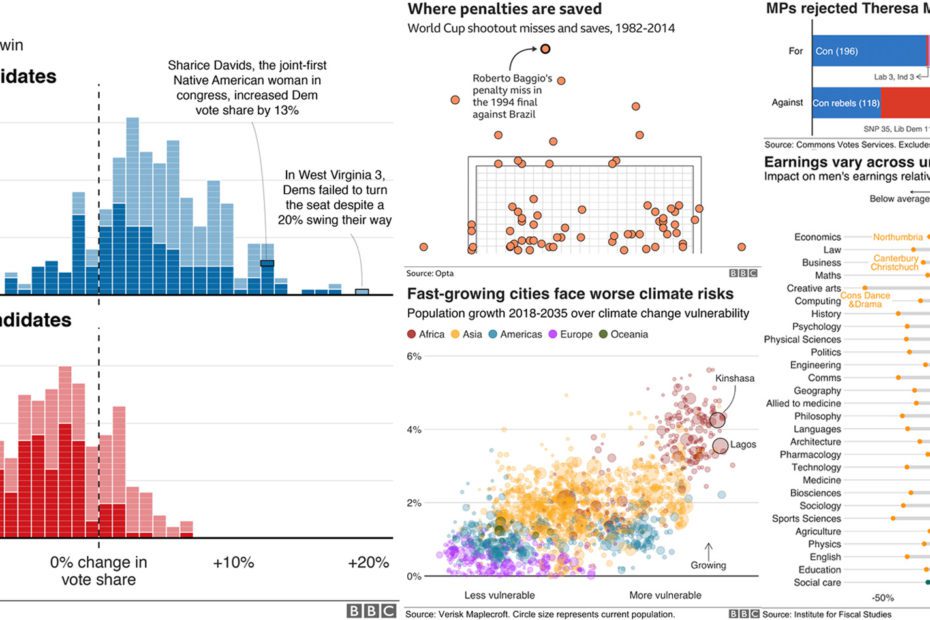
Data Animation: Much Easier than you Think!
In this article, I explain how to easily turn data into videos. Data animations add value to your presentations. They also constitute a useful tool… Read More »Data Animation: Much Easier than you Think!
Visualizations play an increasingly prominent role in the realm of AI. Past a certain point, information simply cannot be conceptualized by staring at words or numbers, you need a picture. Articles in this category focus on visualization at all levels, from analytics to 3D rendering, dashboards to user experience, deep fakes to media blockbusters.
In this article, I explain how to easily turn data into videos. Data animations add value to your presentations. They also constitute a useful tool… Read More »Data Animation: Much Easier than you Think!
This short article is relevant to you if … You’d like to accelerate your development cycles. Your analytics isn’t in the place you want it… Read More »From Excel to Visualization via Ploomber
I spent much of my career in business intelligence and marketing. Programming in R was never one of my top skills. While I started programming… Read More »Neat R Plots with the Cairo Graphics Library
Business Intelligence tools give you the data you need to process reports, create dashboards and visuals. With integrated data, employees can make decisions faster, improve… Read More »Looker vs. Tableau vs. Qlik Sense | Which Wins In 2022?
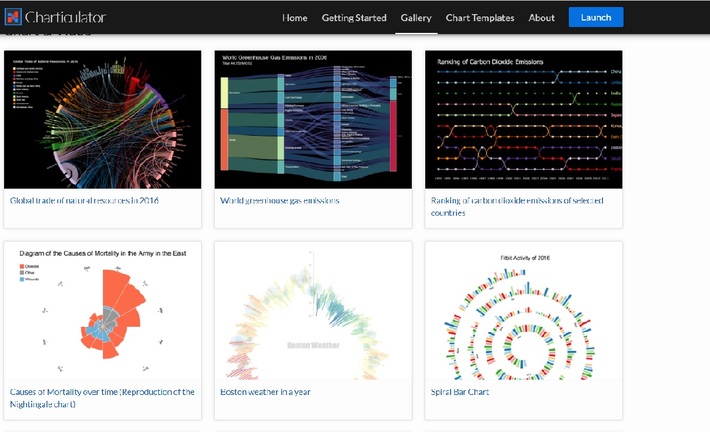
Background Many areas of AI continue to show innovation at an exciting pace. For example, today, generative methods are on my radar. So, its nice… Read More »Charticulator : Creating Interactive Charts Without Code
Image Credit: Instagram.com Influencer marketing is human-centric. So, how can… Read More »AI for Influencer Marketing: How It Is Transforming the Market
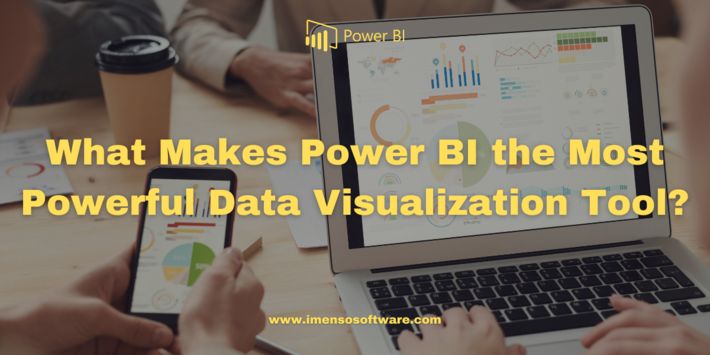
Nowadays, businesses have to rely on data in unprecedented ways. In fact, businesses hailing from various disciplines use massive amounts of data on a daily… Read More »What Makes Power BI the Most Powerful Data Visualization Tool