Home » Business Topics » Business Analytics

Business Analytics

The use of analysis, statistics and related data science tools have become essential to understand and predict business processes and trends. These areas can be considered a high-level analog to Data Science.

data-visualization-benefits-use-cases

The Value of Real-Time Data Visualization and Interpretation

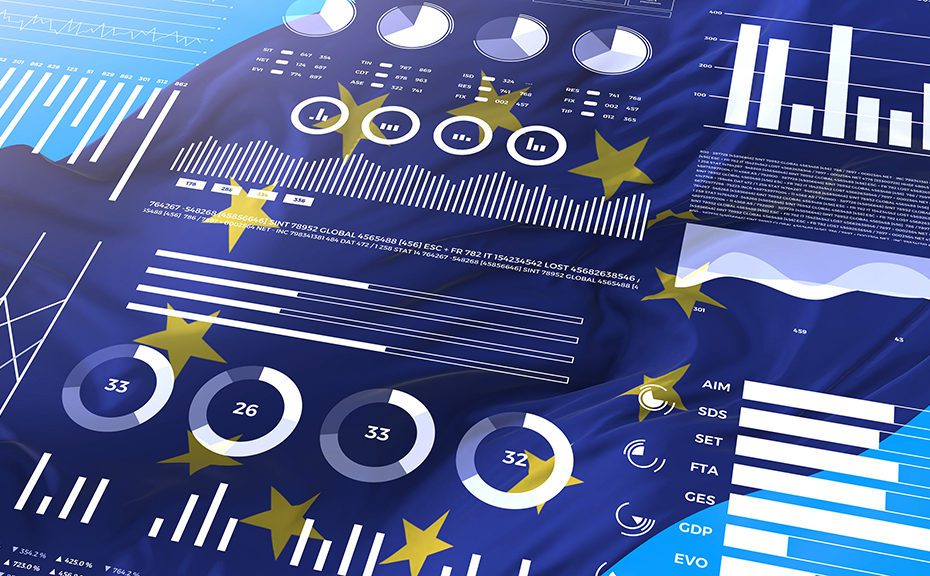
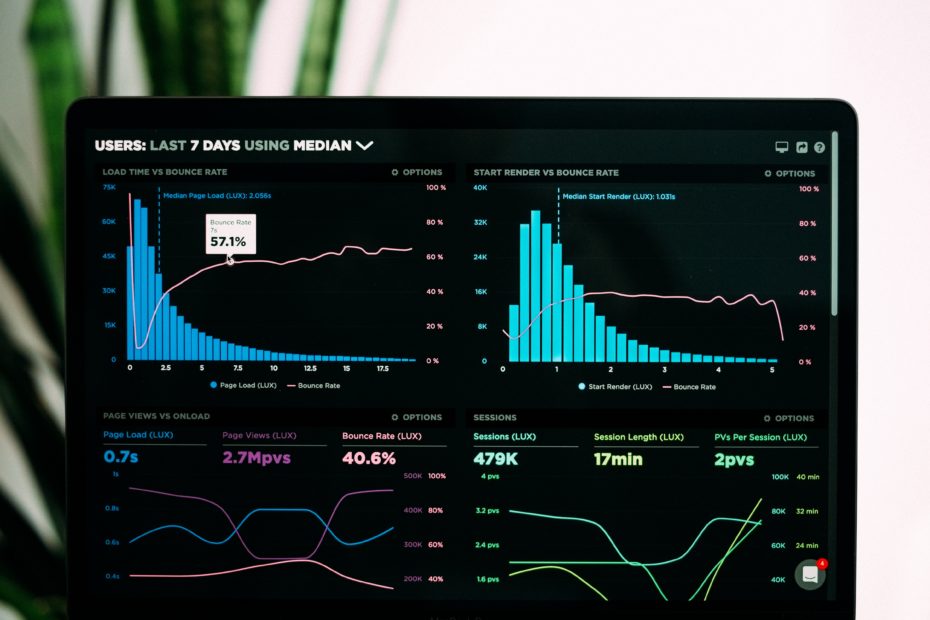
Data representation using graphics such as charts, plots, infographics, heat maps, bubble clouds, scatter plots, mekko charts are referred to as data visualization. Such visual displays and representations of information help communicate complex data relationships and data-driven insights in a way that makes it easy to understand and base decisions on.

Browse By Topic