Fifty years, ago, the lines between “data analysis” and “statistical analysis” were pretty clear. But as data analysis evolved, those lines became blurred. The differences between the two terms are now very much a grey area, but there are still a few notable differences.
What is “Data Analysis”?
Data scientists and statisticians typically define “data analysis” in different ways.
- For a data scientist,data analysis is sifting through vast amounts of data: inspecting, cleansing, modeling, and presenting it in a non-technical way to non-data scientists. The vast majority of this data analysis is performed on a computer.
- If you’re a statistician, instead of “vast amounts of data” you’ll usually have a limited amount of information in the form of a sample (i.e. a portion of the population); Data analysis is performed on this sample, using rigorous statistical techniques.
Both data scientists and statisticians use data to make inferences about consumer cohorts, a general population, or target market. However, they will approach the issue of data analysis quite differently.
- A data analyst will have a data science toolbox (e.g. programming languages like Python and R, or experience with frameworks like Hadoop and Apache Spark) with which they can investigate the data and make inferences.
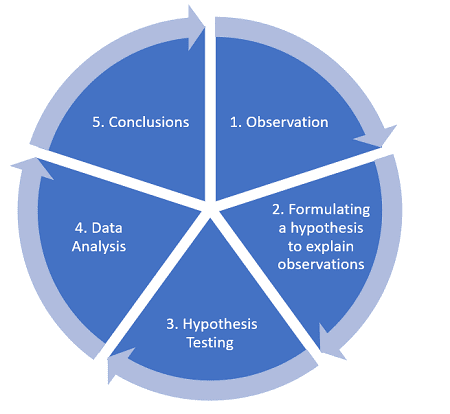
- On the other hand, a statistical analyst will generally use mathematical-based techniques like hypothesis testing, probability and various statistical theorems to make inferences. Although much of a statistician’s data analysis can be performed with the help of statistical programs like R, the analysis is more methodical and targeted to understanding one particular aspect of the sample at a time (for example, the mean, standard deviation or confidence interval).
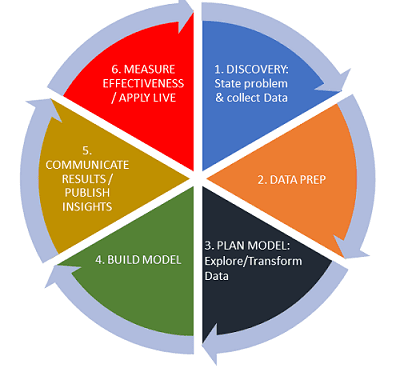
The lifecycle of data is key to data workflow in data science:

You can perform many data analysis steps in data science with very little statistical basis: data prep, transforming data.
What is Statistical Analysis?
Generally speaking, statistical analysis is the science of uncovering patterns and trends in data, using statistics. Note the key word here is “statistics”. In order to perform any statistical analysis at all you have to use statistics. Historically, only statisticians used statistical techniques on data. And data science wasn’t even a thing in the mainframe days of tape mounting and Cobol programming. But as data science has evolved, it’s blended with many areas once thought to be the exclusive realm of the statistician: data visualization, optimization, high-dimensional analysis to name but a few.

Data Analysis vs. Statistical Analysis
There is a large grey area: data analysis is a part of statistical analysis, and statistical analysis is part of data analysis. Any competent data analyst will have a good grasp of statistical tools and some statisticians will have some experience with programming languages like R.
If you’re confused about where the line is, or where that separation occurs, the key question really is,
Are the two fields of data science and statistics really separate entities?
In the “old school” way of thinking about statistics (i.e. grey-haired statistician scribbling formulas in a binder, sifting through tables and performing obscure hypothesis tests understood by few) vs data science (sexy, at the forefront of technological revolution), then you could argue that yes, they are completely separate. However, if you hold the belief that modern statistics is more about “…the broader idea of greater data science (e.g. by putting more focus on computation in education, research and communication)” (Carmichael & Marron, 2018), then the answer is probably no.
References
Carmichael, I. & Marron, J. (2018). Data Science vs. Statistics: two cultures? Perspectives on data science for advanced statistics.
Data Module #1: What is Research Data?
6 Methods of data collection and analysis – The Open University
Whats the difference between statistical analysis and data analysis?
