This resource is part of a series on specific topics related to data science: regression, clustering, neural networks, deep learning, decision trees, ensembles, correlation, Python, R, Tensorflow, SVM, data reduction, feature selection, experimental design, cross-validation, model fitting, and many more. To keep receiving these articles, sign up on DSC. The full series is accessible here.
29 Statistical Concepts Explained in Simple English
- 10% Condition in Statistics: What is it?
- 68 95 99.7 Rule in Statistics
- Absolute Error & Mean Absolute Error (MAE)
- Accuracy and Precision: Definition, Examples
- ADF — Augmented Dickey Fuller Test
- Adjusted R2 / Adjusted R-Squared: What is it used for?
- Akaike’s Information Criterion: Definition, Formulas
- Alpha Level (Significance Level): What is it?
- Alternate Hypothesis in Statistics: What is it?
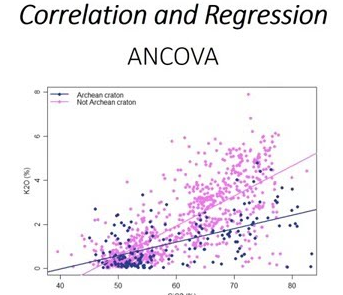
- ANCOVA: Analysis of Covariance
- ANOVA: Analysis of Variance
- ANOVA Excel 2013 (One-Way ANOVA) Easy Steps and Video
- Two Way ANOVA in Excel With Replication / Without Replication
- ANOVA Test: Definition, Types, Examples
- Area Between Two Z Values on Opposite Sides of Mean
- Area Principle in Statistics
- Area to the Right of a z score (How to Find it)
- Arithmetic Mean: What it is and How to Find it
- ARMA Model
- Assumption of Independence
- Assumption of Normality / Normality Test
- Assumptions and Conditions for Regression
- Attributable Risk / Attributable Proportion: Definition
- Attribute Variable / Passive Variable: Definition, Examples
- Autoregressive Model: Definition & The AR Process
- Average – Definition – How to Calculate Average
- Average Deviation (Average Absolute Deviation)
- Average Inter-Item Correlation: Definition, Example
- Balanced and Unbalanced Designs: Definition, Examples
- Segmented Bar Chart: Definition & Steps in Excel.
- Bar Chart / Bar Graph: Examples, Excel Steps & Stacked Graphs
- Bartlett’s Test: Definition and Examples
- Bayesian Information Criterion (BIC) / Schwarz Criterion
- Bayes’ Theorem Problems, Definition and Examples
- Bell Curve (Normal Curve): Definition
- Benjamini-Hochberg Procedure
- Bernoulli Distribution: Definition and Examples
- Bessel’s Correction: Why Use N-1 For Variance/Standard Deviation?
To make sure you keep getting these emails, please add [email protected] to your address book or whitelist us.


Excelente