This article was posted by Bethany Cartwright. Bethany is the blog team’s Data Visualization Intern. She spends most of her time creating infographics and other visuals for blog posts.
Whether you’re writing a blog post, putting together a presentation, or working on a full-length report, using data in your content marketing strategy is a must. Using data helps enhance your arguments by make your writing more compelling. It gives your readers context. And it helps provide support for your claims.

That being said, if you’re not a data scientist yourself, it can be difficult to know where to look for data and how to best present that data once you’ve got it. To help, below you’ll find the tools and list of resources you need to source credible data and create some stunning visualizations.
Resources for Uncovering Credible Data
When looking for data, it’s important to find numbers that not only look good, but are also credible and reliable.
The following resources will point you in the direction of some credible sources to get you started, but don’t forget to fact-check everything you come across. Always ask yourself: Is this data original, reliable, current, and comprehensive?
Tools for Creating Data Visualizations
Now that you know where to find credible data, it’s time to start thinking about how you’re going to display that data in a way that works for your audience.
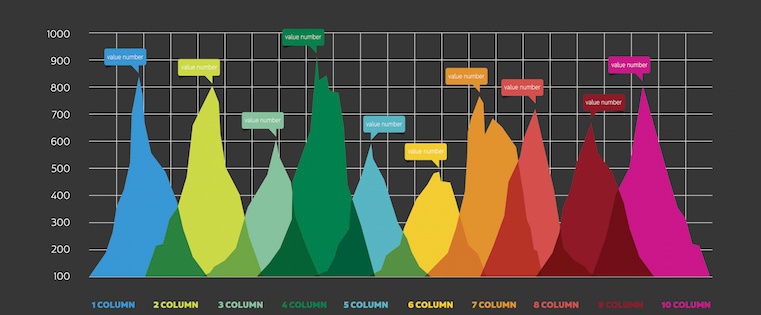
At its core, data visualization is the process of turning basic facts and figures into a digestible image — whether it’s a chart, graph, timeline, map, infographic, or other type of visual.
While understanding the theory behind data visualization is one thing, you also need the tools and resources to make digital data visualization possible. Below we’ve collected 10 powerful tools for you to browse, bookmark, or download to make designing data visuals even easier for your business.
- Excel
- Infogr.am
- Photoshop & Illustrator
- Tableau
- ZingChart
- Timeline JS
- Google Charts or Google Sheets
- Piktochart
To check all this information, click here. For more articles about data visualization, click here.
DSC Resources
- Career: Training | Books | Cheat Sheet | Apprenticeship | Certification | Salary Surveys | Jobs
- Knowledge: Research | Competitions | Webinars | Our Book | Members Only | Search DSC
- Buzz: Business News | Announcements | Events | RSS Feeds
- Misc: Top Links | Code Snippets | External Resources | Best Blogs | Subscribe | For Bloggers
Additional Reading
- What statisticians think about data scientists
- Data Science Compared to 16 Analytic Disciplines
- 10 types of data scientists
- 91 job interview questions for data scientists
- 50 Questions to Test True Data Science Knowledge
- 24 Uses of Statistical Modeling
- 21 data science systems used by Amazon to operate its business
- Top 20 Big Data Experts to Follow (Includes Scoring Algorithm)
- 5 Data Science Leaders Share their Predictions for 2016 and Beyond
- 50 Articles about Hadoop and Related Topics
- 10 Modern Statistical Concepts Discovered by Data Scientists
- Top data science keywords on DSC
- 4 easy steps to becoming a data scientist
- 22 tips for better data science
- How to detect spurious correlations, and how to find the real ones
- 17 short tutorials all data scientists should read (and practice)
- High versus low-level data science
Follow us on Twitter: @DataScienceCtrl | @AnalyticBridge
