
If you’ve been keeping up on the statistics for Covid-19 in the last week (and who hasn’t?), you’ve probably noticed a wide variety of projections for deaths in the United States, ranging from the “best-case” scenario (327 people) to the “doomsday” figure (2.2 million). Recent statistics published include:
- 327 to 1.6 million (Former Former CDC director Tom Frieden, cited in the Washington Post).
- 480,000 (University of Nebraska public health researcher, Dr. James Lawler, cited in the NY Times).
- Anywhere from 200,000 to 1.7 million (CDC, cited in NYMag).
- 2.2 million (Imperial College).
These are all well-known and trusted sources, so it begs the question: Why can’t anyone agree on a number? The answer can be summed up in one word: uncertainty. One small piece of incorrect data fed into a model can have a massive effect on results, which is why calculating Covid-19 statistics poses many challenges for scientists. But the scenario is far from unusual: uncertainty is present in every statistical model, in every situation.
Sources of uncertainty
Sources of uncertainty include:
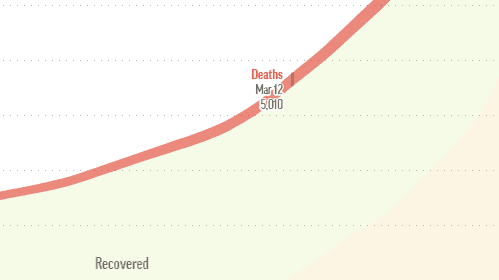
- Interpolation and Extrapolation errors: Interpolation is where you construct new data points based on a set of existing points. This Johns Hopkins/Datawrapper graph, for example, used interpolation to calculate the March 12 data point, due to data reliability (or unreliability, as it may be) on that particular day. In this particular scenario, interpolation probably resulted in a fairly good estimate of the March 12 missing data point. But where problems can really start is extrapolating the data far beyond these known data points, say to three months out. Extrapolation where you take your set of known points (for example, at t = 1 to t = 99) and attempt to figure out what’s going to happen at t = 250. In the case of Covid-19, there simply isn’t enough good data to feed into models, so trying to figure out what’s going to happen at some future point t amounts to not much more than some mathematical guesswork.

- Model bias: any model is an approximation, or a best guess at what a true distribution might look like. Various models have been used to fit Covid-19 incubation data including an Erlang Distribution and (Kucharski et al.) and log normal (Lauer et al.). However, this preprint suggests that the incubation period doesn’t follow any of the usual incubation distributions like lognormal, Weibull, or Gamma distributions. A model can be learned from good data. But in the case of Covid-19, “good” data is is hard to come by. Even if we did have great source data, models can be wildly incorrect. In the Fall of 2014, the CDC projected that between 550,000 to 1.4 million cases of Ebola would develop by January of the following year in Liberia and Sierra Leone. The actual figure? 28,600.
- Measurement errors: Errors can happen because of imperfect observation methods, or an uncontrolled environment. They can also creep in when translating mathematical models into a computer. Two of the largest difficulties that researchers are facing: China, where the novel coronavirus emerged, keeps on changing how it counts cases. In addition, tests for Covid-19 are in short supply, in part because of the unavailability of some test components (such as reagent chemicals and the specialized swabs). These two facts alone would be enough to invalidate any attempts at modeling. In a theoretical setting, one would simply go back to the drawing board and re-collect new data. But this isn’t an option with the outbreak; If you have weak data and need to make a decision, then “you just combine your information as best you can” (Andrew, posted on Columbia.edu).
- Parameter uncertainty: This happens because we don’t know the exact values in a population—we can only take a good guess with sampling. The fuzzy data and lack of testing means that any statistical model for Covid-19 is only based on sample–a portion of the population. With the downright biased (full of errors) samples coming out of the recent epidemic, statistical models are going to behave pathologically.
- Selection bias: The best models include an element of randomness, which is why ideally, people should be randomly selected for testing. Lack of available testing kits mean that there aren’t enough testing kits for every potential or mild case (the CDC Coronavirus Self-checker currently advises people to “stay at home and take care of yourself” unless you’re experiencing life-threatening symptoms). However, patients being tested for Covid-19 tend to fall into the severe to fatal end of the illness spectrum.
All of this uncertainty results in a pathologically wide range of models, where nothing is certain. That’s not to say that the doomsday predictions about Covid-19 are incorrect. We just don’t know.
Why Not Wait Until We Have Reliable Data?
On any ordinary day, millions of statistical models are generated and most are tossed out. Statistical models are challenging to get right, even with an abundance of good data. In the vast majority of cases, a scientist can just rework the data, find a better model, and take time to get the model right. With Covid-19, taking time to get a good model is a luxury; People want and need answers now.
References
Disease modelers gaze into their computers to see the future of Cov…