
A candlestick chart is sometimes used by stock market technicians to make trading decisions. Each candlestick graphically depicts the following prices simultaneously: opening, closing, high, and the low. An interesting question is whether candlesticks can be used for pattern recognition purposes. Traders directly interpret the charts – applying a type of pattern recognition that might involve industry norms and personal judgment. But I mean using a systematic or algorithmic process. Before examining this question more closely, I first want to elaborate on the exact structure of a candlestick – or at least my version of one which I call a tendril-candlestick. I added tendrils to my candlestick charts to show price-change information. The illustration below is for an “all green” tendril-candlestick combination. At the moment, there are 505 possible combinations depending on the counting method – due to various exceptional scenarios. (There are 506 if a “zero-change” candlestick is included – although it doesn’t have any form.)
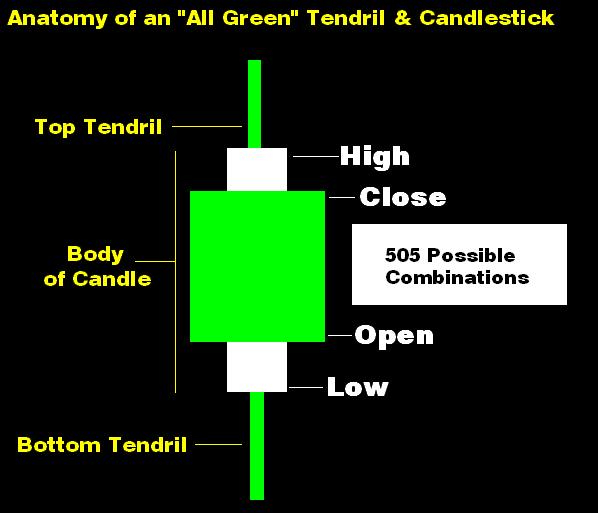
For the average technical trader, a term like “combination” might not make much sense since they tend to use proper names. But in order to allow a computer program to digest the data, it is necessary to formally codify each variation. Proper names don’t really add to the analysis; however, it is important to have a code for each combination. A coding system is required to define when the data indicates, for example, when a “gcc” tendril-candlestick combination has occurred: a gcc is an all-green candlestick “g”; having a type “c” shape for the candlestick; and a type “c” top and bottom for the tendril.
Once the ontological presets have been established defining how a body of data gives rise to different combinations, I would say the most amusing ordeal to overcome from a programming standpoint is the use of “reverse data.” Why reverse the data? Well, normally when digesting data, the program reads from the beginning (situated typically at the top of the file) to the end; this means that using this approach it is possible to buffer past data but not future data. (It is true that all of the future data is already past data; but I mean from the perspective the read, the program cannot know what it hasn’t already read.) I reverse the data in order to make the past read data the future data. I provide a graphical explanation below to spare others from the annoying mental challenge.
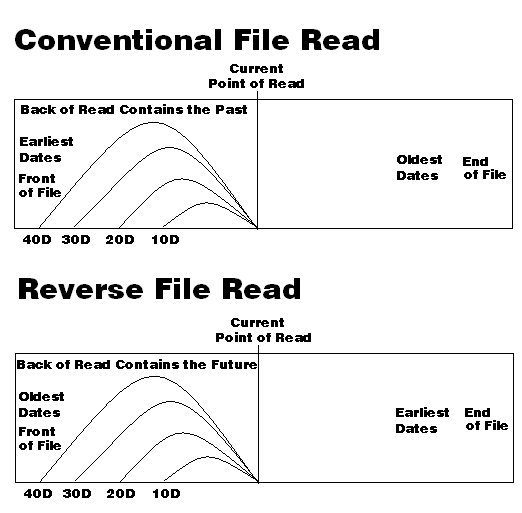
While on the subject of past and future data, I would say that technical analysis is a bit unusual in terms of the general objective. Normally, one reads from the past in order to predict the future: this means that the basis of comparison – the thing being pattern-matched – is the past. In technical analysis, because each tendril-candlestick combination represents a body of data, it becomes apparent that the basis of comparison is a combination or series of combinations – more a data object than a simple linear pattern of numbers. The lead for development should probably be taken by the algorithmic designer more than the average statistician.
I include the file-read illustration to also show – for those perhaps unfamiliar with programming – how the thinking patterns involved in programming aren’t quite same as mathematics. Programming that is perhaps detailed enough to manipulate pixels and binary files – the kind that I will perform in a moment on the GUI – is mostly about organizing, controlling, and regulating processes. Programming is a process of making use of processes to make other processes. This is my perspective anyways.
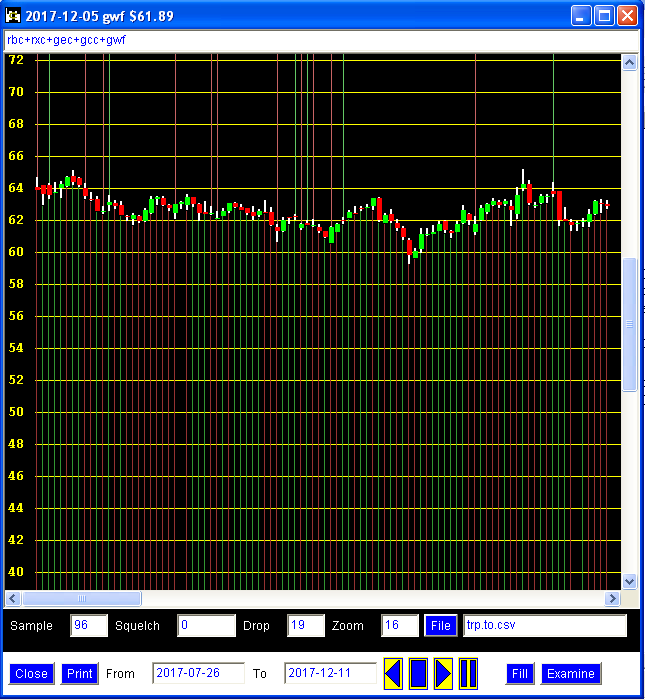
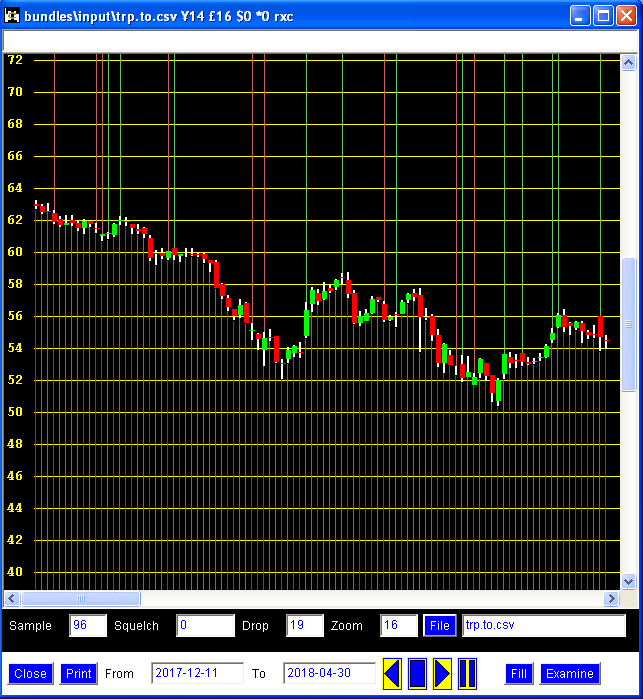
The chart below is for the stock belonging to Trans Canada Pipeline – rendered on a program that I wrote. Notice the string of characters near the top of the frame: rbc + rxc + gec + gcc + gwf. Each element is a character code for a tendril-candlestick combination. Together these codes form the last 5 tendril-candlesticks to the right of the chart. Further to the right of this particular chart, the stock declines about $10 per share. The question then is whether the tendril-candlestick combinations in series can predict the outcome.
Based on the tendril-candlestick series, the pattern-matching system offers the potential outcome shown below – rendered on Excel. Don’t be too concerned about the units on the y-axis. I would say that the nature of the units is excessively detailed to elaborate on this blog. The important point is that the units are negative – indicating that pattern-matching is pointing to lower prices.
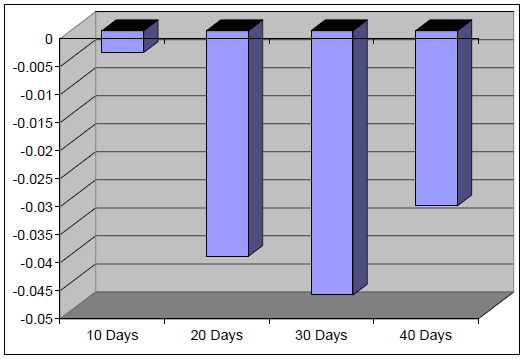
The next chart shows what actually happened to the stock. The stock declined strongly before recovering slightly at the 40 to 50 trading day mark. Somebody who disagrees with this methodology might say, of course the algorithm is capable of determining the associated pattern since it already has all of the past data loaded. This is absolutely true. But the algorithm considers every instance of each tendril-candlestick combination – not just the instance that occurred immediately before the decline in price. Consequently, it would seem that at least in some cases, certain combinations or series of combinations can be reasonably associated with particular past behaviours. Whether or not this association persists into the future is a separate issue.
I would like to state plainly that the pattern-matching system doesn’t always work well or in quite the same way. In fact, it routinely doesn’t work well. I merely chose a good example to present to the data science community. However, this blog is not about whether or not I have a system that “works” per se – i.e. so I can become a stock-trading lord – but rather the general idea of making use of this type of pattern recognition to examine shifts in market sentiment. Tendril-candlestick combinations can be used almost as a linguistic device to characterize how investors “feel.” Whether or not these feelings give rise to exactly the same behaviours repeatedly and under which circumstances is quite another issue perhaps for me to consider in greater detail later.
I believe that for certain segments of the investment community, technical analysis is a bit like astrology, fortune telling, or numerology. There is an important lesson here for data scientist. There is the idea that a fairly elaborate hierarchy of norms possibly disconnected from reality can preoccupy practitioners. “This is what the heavens are telling us when Jupiter and Mars are aligned in Capricorn,” an astrologer might say. For data scientists, we can consider the terrible lack of competency demonstrated in relation to predictions of a landslide victory by Hillary Clinton against Donald Trump. Here is a lot of data. Here is the analysis. This is what it means. Wrong. I am saying that data scientists sometimes deserve the same criticism thrown at fortune tellers and numerologists. The process might appear scientific on the outside, but deep inside it is quasi-intellectual.
I suspect that the ridicule is due to the external imposition of meaning over what the candlestick patterns mean – especially if there is lack of evidence. This external definition was likely driven to some extent by the technologies available in the past – and the need to create universal rules of thumb to help practitioners provide guidance. But today with computers being available and so many people being capable of creating algorithms, the meaning of patterns can be internally conceived. Moreover, the meaning does not have to be universal. It can be contextual – e.g. for a particular stock and within a place in history such as the Trump years – rather than for all stocks expressed as some kind of natural law. In fact, beyond the stock market, technical analysis has the potential to bring analytics much closer to the narratives of people. But the metrics must be moved closer and designed to be shaped by the people. The internal conception of truth is so post-modernist. Yet it is precisely these patterns that companies need to understand most.