
In a previous blog I wrote about 6 potential applications of time series…. To recap, they are the following:
- Trend analysis
- Outlier/anomaly detection
- Examining shocks/unexpected variation
- Association analysis
- Forecasting
- Predictive analytics
Here I am focusing on outlier and anomaly detection. Important to note that outliers and anomalies can be synonymous, but there are few differences, although I am not going into those nuances.
WHAT IS AN OUTLIER?
In terms of definition, an outlier is an observation that significantly differs from other observations of the same feature. If a time series is plotted, outliers are usually the unexpected spikes or dips of observations at given points in time. A temporal dataset with outliers have several characteristics:
- There is systematic pattern (which is deterministic) and some variation (which is stochastic)
- Only a few data points are outliers
- Outliers are significantly different from the rest of the data
WHY DETECT OUTLIERS?
Broadly for two reasons:
(1) In business applications the project managers should know if an outlier represents an error. Or are there specific reasons they should be concerned of (if undesired) or excited about (if desired).
(2) In research and statistical modeling projects outliers impact model performance. So they are removed during model fitting to enhance prediction accuracy.
REAL WORLD APPLICATION DOMAINS (few of many)
- Financial market: Price manipulation, fraudulent transactions and fraud detection in banking and stock market exchange
- Credit card: fraud detection algorithms detect any unusual/fraudulent financial transactions or credit card theft
- Computer network: Detecting network intrusion based on anomalous traffic in computer networks
- Process industries: Anomaly detection in pulp and paper industries and other process industries
- Aviation: Aircraft sensor monitoring to observe any potential malfunction
- Healthcare: Abnormal patient conditions based on reading electrocardiogram (ECG) recordings of heart beat pulses
- Recommender systems: Detection of attacks in Recommendation Systems to alter recommendations
- Hydrology: Real time monitoring of hydrological monitoring and management of water resources
- Web analytics: Detecting unexpected growth or drop in website visit and monitoring any significant statistical variations and anomalies
- Weather forecast: Real-time weather monitoring based on satellite, radar and ground measurements to detect extreme events
- Acoustic monitoring: real-time acoustic monitoring of oceanic activities for research and other applications such as environmental conservation
- Geology: Observation of earthquake and seismic activities due to anthropogenic causes such as nuclear tests.
- Astronomy: In astronomy detecting outliers in the observation of features and characteristics of stars and galaxies. Most famous of all is probably the recent gravitational waves detection.
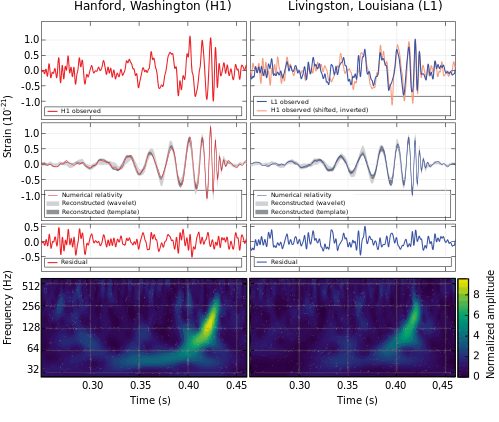 LIGO measurement of the gravitational waves at the Livingston (right) and Hanford (left) detectors,
compared with the theoretical predicted values (Source: Wikipedia)
TOOLS AND METHODS (few of many)
- STL: This decomposes time series data into 3 components: seasonality, trend and residue
- Generalized Extreme Student Deviation
- ARIMA: There is a R package called tsoutliers to do exactly this.
- AnomalyDetection R package
- Mean Absolute Deviation (MAD) for real time monitoring of streaming data
- Exponential smoothing: By observing the deviation of unsmoothed data with the smoothed ones
- Sliding window-based forecasting method: This approach uses a forecasting model built using past data within a given window and predicts a future value. If an observed value significantly differs from predicted value, it’s an outlier.
- Peer Group Analysis